Fig. 3
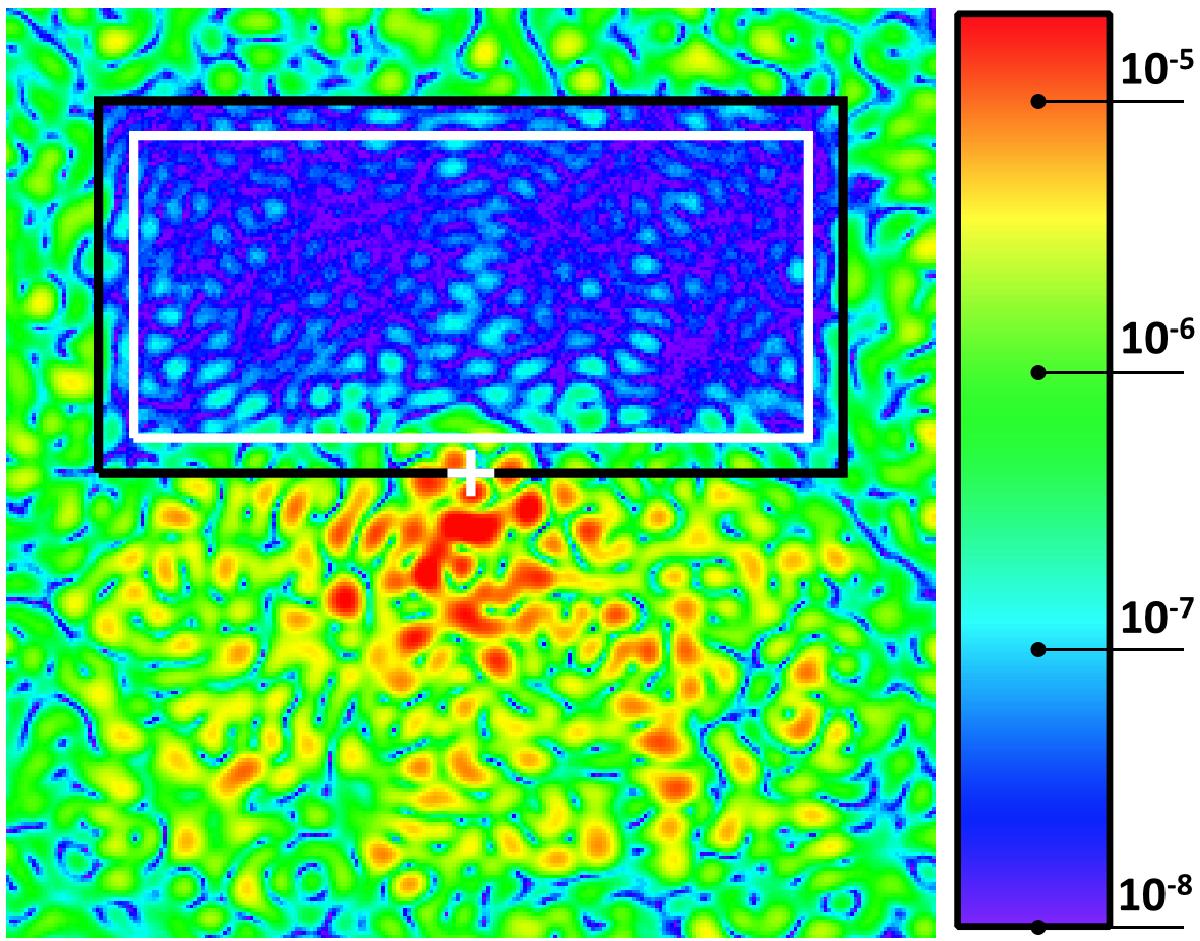
Numerically simulated coronagraphic image obtained after an SCC correction in monochromatic light. Simulation parameters are given in Table 1. Black line: DH (16 λ0/D by 32 λ0/D). White line: computation area (13 λ0/D by 29 λ0/D). White cross: optical axis. Field of view: 40 λ0/D by 40 λ0/D. The color bar associated with this image is the same for all the coronagraphic images in the paper.
Current usage metrics show cumulative count of Article Views (full-text article views including HTML views, PDF and ePub downloads, according to the available data) and Abstracts Views on Vision4Press platform.
Data correspond to usage on the plateform after 2015. The current usage metrics is available 48-96 hours after online publication and is updated daily on week days.
Initial download of the metrics may take a while.