Fig. 14
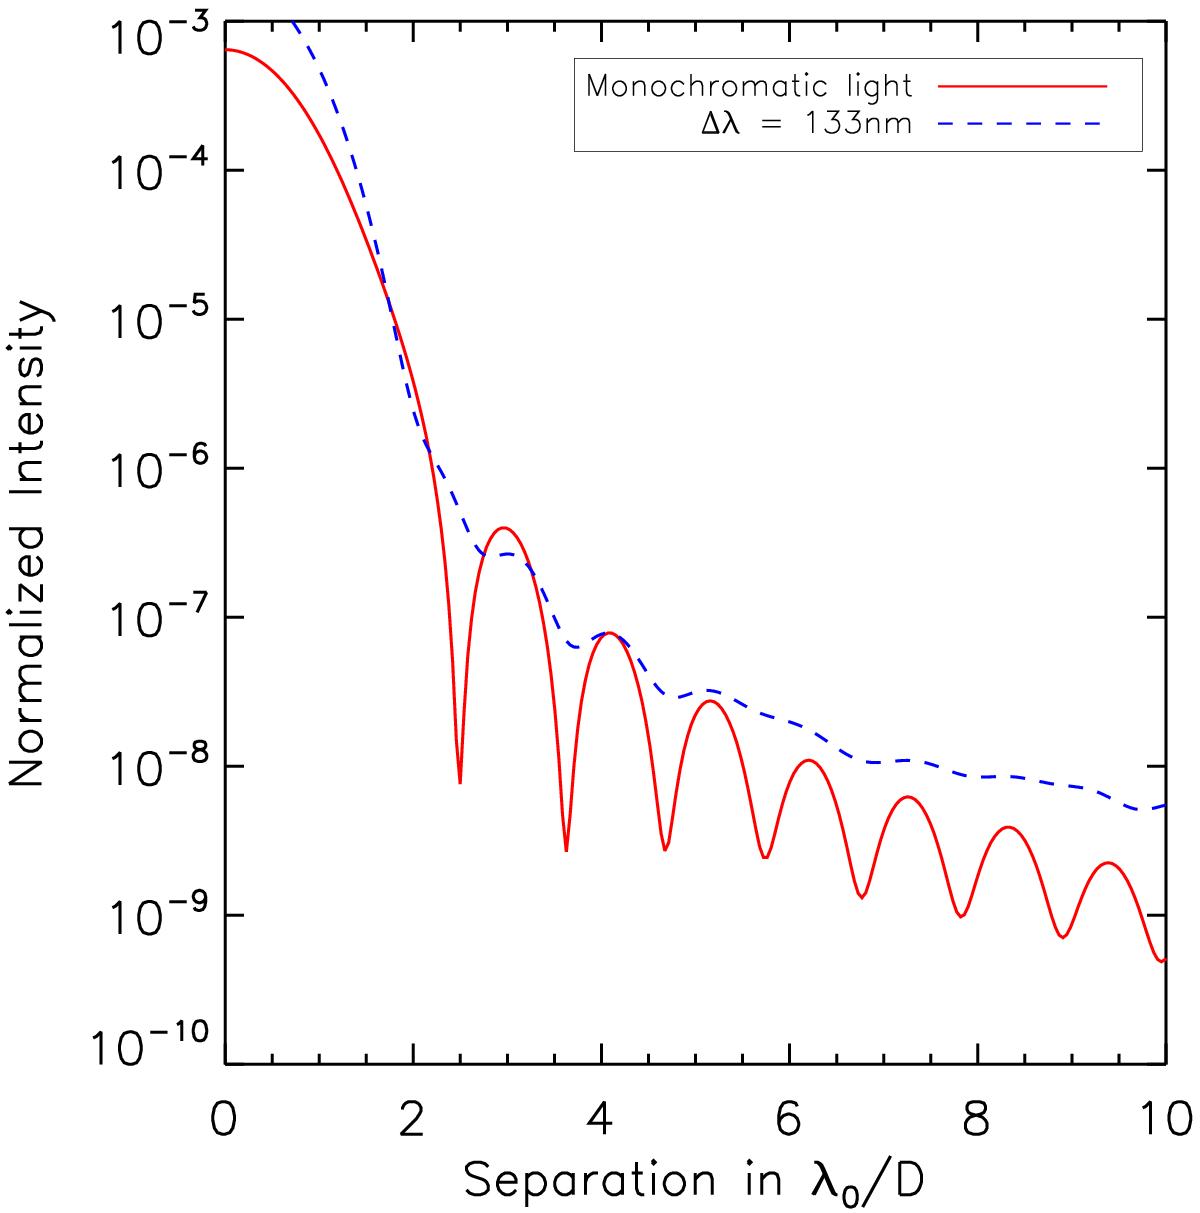
Radial intensity profiles computed from coronagraphic images obtained by numerical simulations without phase and amplitude aberrations. The red solid curve is the profile associated with an image obtained in monochromatic light while, the blue dashed lines are obtained in polychromatic light (Δλ = 133 nm around λ0 = 665 nm).
Current usage metrics show cumulative count of Article Views (full-text article views including HTML views, PDF and ePub downloads, according to the available data) and Abstracts Views on Vision4Press platform.
Data correspond to usage on the plateform after 2015. The current usage metrics is available 48-96 hours after online publication and is updated daily on week days.
Initial download of the metrics may take a while.