Free Access
Fig. 1
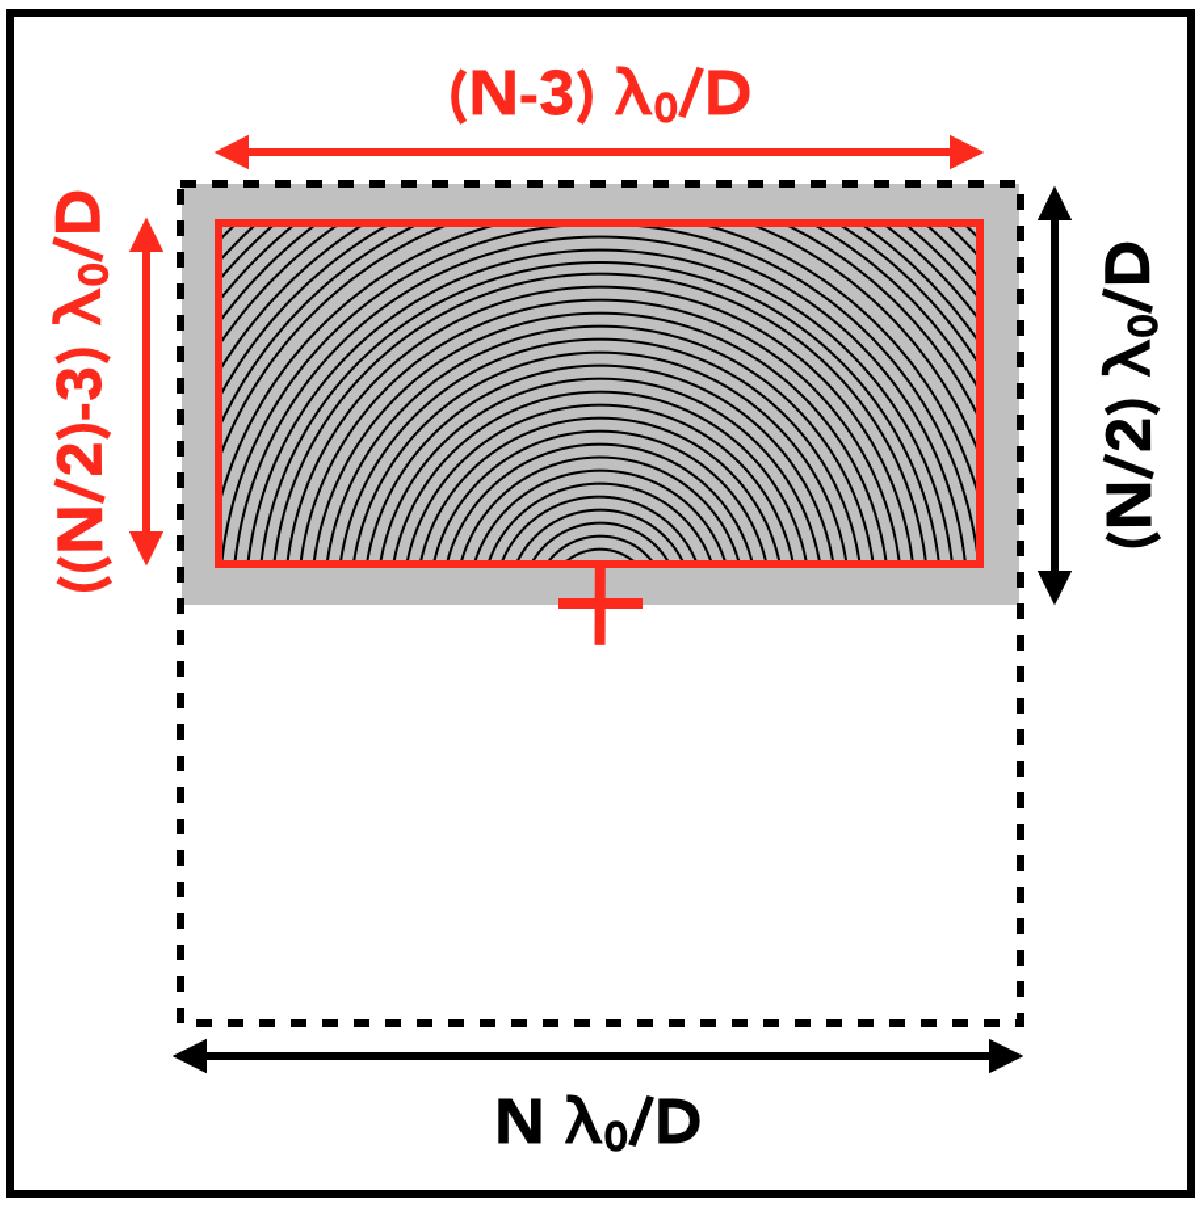
Influence area of the DM (dashed line), DH (gray area) and computation area (red solid line). The annuli of ![]() width in the computation area are used to compute the contrast curves. The red cross represents the optical axis.
width in the computation area are used to compute the contrast curves. The red cross represents the optical axis.
Current usage metrics show cumulative count of Article Views (full-text article views including HTML views, PDF and ePub downloads, according to the available data) and Abstracts Views on Vision4Press platform.
Data correspond to usage on the plateform after 2015. The current usage metrics is available 48-96 hours after online publication and is updated daily on week days.
Initial download of the metrics may take a while.