Free Access
Fig. 7
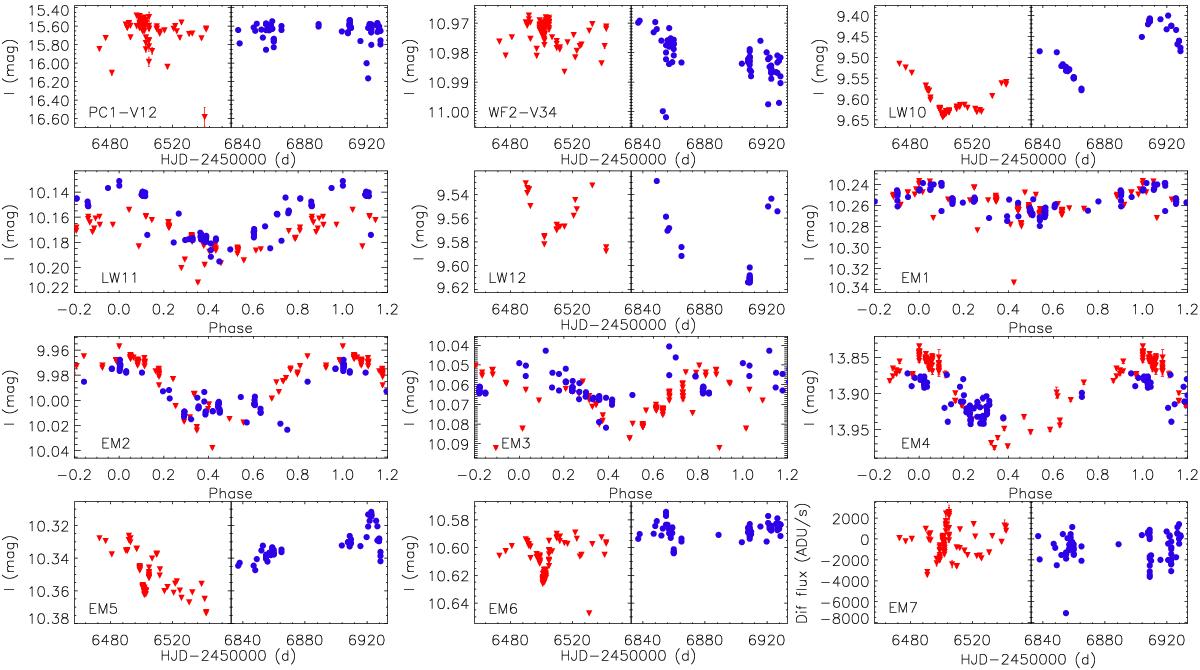
NGC 104: light curves of the known and new variables discovered in this globular cluster. Red triangles correspond to the data obtained during the year 2013 and blue circles correspond to the data obtained during the year 2014. For EM7, we plot the quantity fdiff(t) /p(t) since a reference flux is not available.
Current usage metrics show cumulative count of Article Views (full-text article views including HTML views, PDF and ePub downloads, according to the available data) and Abstracts Views on Vision4Press platform.
Data correspond to usage on the plateform after 2015. The current usage metrics is available 48-96 hours after online publication and is updated daily on week days.
Initial download of the metrics may take a while.