| Issue |
A&A
Volume 588, April 2016
|
|
|---|---|---|
| Article Number | A129 | |
| Number of page(s) | 9 | |
| Section | Interstellar and circumstellar matter | |
| DOI | https://doi.org/10.1051/0004-6361/201527546 | |
| Published online | 30 March 2016 | |
On the origins of polarization holes in Bok globules
1
University of Kiel, Institute of Theoretical Physics and
Astrophysics,
Leibnizstrasse 15,
24118
Kiel,
Germany
e-mail: This email address is being protected from spambots. You need JavaScript enabled to view it.
; This email address is being protected from spambots. You need JavaScript enabled to view it.
2
University of Heidelberg, Institute of Theoretical
Astrophysics, Albert-Ueberle-Str. 2
U04, 69120
Heidelberg,
Germany
e-mail:
This email address is being protected from spambots. You need JavaScript enabled to view it.
Received: 13 October 2015
Accepted: 16 February 2016
Abstract
Context. Polarimetric observations of Bok globules frequently show a decrease in the degree of polarization towards their central dense regions (polarization holes). This behaviour is usually explained with increased disalignment owing to high density and temperature, or insufficient angular resolution of a possibly complex magnetic field structure.
Aims. We investigate whether a significant decrease in polarized emission of dense regions in Bok globules is possible under certain physical conditions. For instance, we evaluate the impact of optical depth effects and various properties of the dust phase.
Methods. We use radiative transfer modelling to calculate the temperature structure of an analytical Bok globule model and simulate the polarized thermal emission of elongated dust grains. For the alignment of the dust grains, we consider a magnetic field and include radiative torque and internal alignment.
Results. Besides the usual explanations, selected conditions of the temperature and density distribution, the dust phase and the magnetic field are also able to significantly decrease the polarized emission of dense regions in Bok globules. Taking submm/mm grains and typical column densities of existing Bok globules into consideration, the optical depth is high enough to decrease the degree of polarization by up to ΔP ~ 10%. If limited to the densest regions, dust grain growth to submm/mm size and accumulated graphite grains decrease the degree of polarization by up to ΔP ~ 10% and ΔP ~ 5%, respectively. However, the effect of the graphite grains occurs only if they do not align with the magnetic field.
Key words: ISM: clouds / dust, extinction / ISM: magnetic fields / polarization / radiative transfer / stars: protostars
© ESO, 2016
1. Introduction
The evolution of a collapsing molecular cloud to an evolved star is not yet fully understood. In particular, the impact of magnetic fields on star formation is an important part of the ongoing discussion (Matthews & Wilson 2002; Pudritz et al. 2014; Seifried & Walch 2015). For instance, magnetic fields are considered as stabilising star-forming regions and filaments against contraction which is a possible explanation of observed low star formation rates, compared to the amount of gas in star-forming regions (Van Loo et al. 2015; Federrath 2015). Magnetic fields are also expected to influence the shape of cloud fragments and the coupling between the gas and dust phase in molecular clouds (Henning et al. 2001).
In general, magnetic fields are indirectly measured by polarimetric observations in the near-IR or submm/mm regime (see e.g. Bertrang et al. 2014). Elongated dust grains are thought to align with their longer axis perpendicular to the magnetic field lines, which causes polarized thermal emission and dichroic extinction of the dust phase. Various mechanisms have been proposed to explain the alignment of dust grains (paramagnetic relaxation, Davis & Greenstein 1951; mechanical alignment, Gold 1952; radiative torque alignment, Lazarian 2007). Nevertheless, the impact of each alignment mechanism strongly depends on the environment that is been considered. For example, mechanical alignment only appears in regions with supersonic flows (Lazarian 1995) whereby radiative torque alignment is very efficient in a strong anisotropic radiation field (Matsumura et al. 2011).
Polarimetric observations of molecular clouds sometimes show a decrease in the degree of polarization towards dense regions (polarization holes; Rao et al. 1998; Matthews 2005). The origin of this effect is not yet understood, but is usually explained with an assumed increased disalignment of the dust grains, owing to higher density and temperature (Goodman et al. 1992; Hildebrand et al. 1999; Henning et al. 2001; Wolf et al. 2003) or insufficient angular resolution of a possibly complex magnetic field structure (Glenn et al. 1999; Wolf et al. 2004; Matthews 2005). However, the relevance of these effects has not been confirmed quantitatively.
In the optically thin case, elongated dust grains cause polarized emission that is due to the different absorption cross-sections of their axes. In the optically thick case, this difference of the cross-sections causes dichroic extinction instead. The transition between both cases is expected to show a decreased degree of polarization. For this reason, we investigate the influence of the optical depth and related physical properties of the dust on the polarized emission of Bok globules and their potential to significantly decrease the degree of polarization of dense regions.
Given a sufficiently high angular resolution, all Bok globules have so far shown this quantitative behaviour of their radial submm polarization profile (Henning et al. 2001; Wolf et al. 2003, 2004). Bok globules are dense and cold molecular clouds where low-mass star formation typically takes place (Bok & Reilly 1947; Clemens et al. 1991). They often have a simple spherical shape which supports modelling approaches. To achieve our aims, we create a generic analytical model of a Bok globule. We use observational constrained parameters of the Bok globule B335 to ensure that the model is a good approximation of a real Bok globule (Wolf et al. 2003; Evans et al. 2005; Olofsson & Olofsson 2009; Bertrang et al. 2014; Launhardt et al. 2010). The globule B335 is suitable because observations at λ = 850 μm show that the degree of polarization decreases from ~15% at the envelope to ~2% at the centre. Furthermore, we vary selected parameters, such as dust grain size and density distribution, to cover different kinds of Bok globules and investigate the impact of such parameters on the answer of our key question.
Based on our model of a Bok globule, we perform continuum radiative transfer simulations in the submm/mm regime with the radiative transfer code POLARIS (POLArized RadIation Simulator, Reissl et al. 2016) which is able to consider magnetic fields and the dust grain alignment mechanisms mentioned above. From POLARIS, we obtain intensity and polarization maps to investigate a potential decrease in the degree of polarization.
We begin this study with an introduction of our reference model that is based on the Bok globule B335, which includes the chosen magnetic field and the alignment mechanisms (see Sect. 2). Subsequently, we present the results and start with an analysis of the influence of the optical depth on the degree of polarization in our reference model (see Sect. 3). This analysis is followed by a general discussion of the optical depth effect. After that, we investigate under which conditions the optical depth and other physical quantities are able to cause a significant decrease in the degree of polarization. Finally, we summarize the results and give a conclusion in Sect. 4.
2. Model description
2.1. Density distribution
The density distribution of the gas and dust phase is based on a Bonnor-Ebert sphere with a constant central density which can be written as follows (Kaminski et al. 2014): 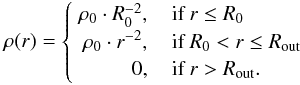 (1)Here, ρ0 is a reference density used to achieve the preset Bok globule mass, r is the radial distance from the central stellar object, and R0 is a truncation radius that defines the extent of the central region with constant density.
For our reference model, we consider a truncation radius of R0 = 103 AU and an outer radius of Rout = 1.5 × 10⁴ AU to fit with the radial brightness profile of the Bok globule B335 (see Fig. 2, left; Wolf et al. 2003). Investigations of the line-of-sight optical depth need a model that is in agreement with column densities that are derived from existing Bok globules. Typical values of the beam-averaged hydrogen column density are between NH,beam = 1027 m-2 and NH,beam = 1028 m-2 (Launhardt et al. 2010). This corresponds to total masses between Mgas ~ 4 M⊙ and Mgas ~ 40 M⊙ for our reference model which is in agreement with other mass estimations of Bok globules (Mgas = { 2,100 } M⊙; Bok 1977; Leung 1985; Clemens et al. 1991). The default parameters of our reference model are summarised in Table 2, but within the scope of our study, we vary selected parameters with regard to different kinds of Bok globules.
2.2. Dust
We assume compact, homogeneous and oblate dust grains, consisting of 62.5% silicate and 37.5% graphite (MRN-dust, Mathis et al. 1977; optical properties from Weingartner & Draine 2001). The ratio between the longer and shorter axis is 1: 0.5. For the grain size distribution we assume  (2)where n(a) is the number of dust particles with a specific dust grain radius a.
Table 1 illustrates the spectral index of selected Bok globules that show one or more polarization holes. These as well as other Bok globules feature a low spectral index in the submm/mm regime of their total flux. A spectral index between two and three is usually a sign of advanced dust grain growth (Natta et al. 2007). Considering dust grain growth up to submm/mm size in our reference model, the spectral index derived from the simulated flux at 850 μm and 450 μm amounts to ~2.8, which is in agreement with observations (for minimum and maximum grain size see Table 2). This spectral index corresponds to an emissivity index β of ~0.8.
Overview of dust grain growth in selected Bok globules with one or more polarization holes.
2.3. Magnetic field
We assume a constant magnetic field strength of B ~ 140 μG (B335, Wolf et al. 2004) in the whole Bok globule model. The magnetic field lines are oriented perpendicular with respect to the observer (y-direction in Figs. 3 and 8). Other more complex magnetic field structures are also possible, but they would increase exceedingly the number of free parameters.
2.4. Alignment mechanisms
We consider the following mechanisms for aligning oblate dust grains perpendicular to the magnetic field:
-
Radiative torque alignment (RAT) For this mechanism, dust grains are considered as having a helicity that causes them to spin up by being radiated in an anisotropic radiation field with wavelengths less than their diameter (Lazarian 2007; Lazarian & Hoang 2007; Hoang & Lazarian 2009; Andersson et al. 2015). The spinning dust grains align through the Barnett effect (Barnett 1915), which is opposed by gas bombardment, which reduces the alignment. We emphasise that our model uses perfect oblate spheroids to approximate oblate spheroids with a helicity. Usually, perfect oblate spheroids have no helicity.
-
Imperfect internal alignment In general, the largest moment of inertia is not perfectly aligned with the angular momentum (Purcell 1979). Fluctuations in the thermal energy will randomly excite rotation around all three body axes with energies in the order of kTd (Td: dust temperature). If the rotational energy of the grain is ≫ kTd, then these thermal fluctuations are negligible and Barnett dissipation aligns the dust grains with their largest moment of inertia to the angular momentum (Jones & Spitzer 1967; Lazarian & Roberge 1997). However, the grains in molecular clouds are likely to have rotational energies ~kTd that results in imperfect internal alignment.
We do not consider paramagnetic relaxation (Davis & Greenstein 1951), because simulations of our reference model show that this alignment mechanism is negligible compared to the RAT theory. We do also not assume supersonic flows and, therefore, we neglect mechanical alignment (Gold 1952).
2.5. Radiative transfer
We apply the three-dimensional continuum RT code POLARIS (POLArized RadIation Simulator, Reissl et al. 2016). This solves the radiative transfer problem self-consistently with the Monte Carlo method, and it considers magnetic fields as well as various dust grain alignment mechanisms. We use it to calculate the spatial temperature distribution of our Bok globule model and derive thermal emission maps using the full Stokes vector. The required optical properties of the dust grains are derived from the complex refractive index of the given material by using the Discrete Dipole SCATtering code (DDSCAT, see Sect. 2.2; Draine & Flatau 2013). However, DDSCAT is not able to calculate the optical properties of dust grains with a ≫ λ. We compensate for this by using the MIEX scattering routine for these dust grains (Wolf & Voshchinnikov 2004). This approximation is justified, because their optical properties are almost isotropic at this size. We simulate the thermal emission of our reference model at λ = 850 μm, because many observations of polarization holes have been performed at this wavelength (e.g. with SCUBA/JCMT).
The implementation of the radiative torque alignment requires us to specify the free parameter fhigh,J, which describes the ratio between dust grains rotating with high- and low-angular momentum. In the RAT theory, only these two rotational states are stable (Hoang & Lazarian 2008). A grain with another angular momentum converges towards one of these stable points. The point of low angular momentum is prone to thermal bombardment of gas particles, which reduces the degree of alignment. Dust grains at the point of high angular momentum are not expected to be influenced by thermal disalignment and, therefore, perfectly aligned. In reality, fhigh,J depends on physical quantities such as temperature and density but cannot be calculated analytically (Hoang & Lazarian 2014). In POLARIS, fhigh,J is implemented by using one value for the whole model. For our reference model, we consider fhigh,J = 0, but we also investigate the influence of other values in this parameter (see Sect. 3).
2.6. Heating source
The primary heating source is a central young stellar object (YSO). The YSO is characterised by an effective temperature and radius with values which are summarised in Table 2.
Overview of the default parameters of our reference model.
 |
Fig. 1 Distribution of the mean degree of polarization Pl vs. the intensity FI across the Bok globule models. The intensity FI is normalized to the maximum intensity F0 of the respective Bok globule. The Bok globule models have total masses of Mgas = { 8,12,16,20,24,28,32,36,40 } M⊙ inside of R = 1.5 × 10⁴ AU (λ = 850 μm). |
3. Results
3.1. Reference model
Our reference model consists of a spherical distribution of perfectly mixed gas and dust around a stellar heating source in its centre (see Sect. 2.6). The density distribution is given in Eq. (1); The size distribution of the dust grains is given in Eq. (2). An overview of the parameters of the reference model is shown in Table 2.
In the following sections, we perform simulations using the reference model and vary only one particular parameter at a time to consider the behaviour of the degree of polarization in various Bok globules.
We calculate the degree of polarization from the simulated thermal emission of the dust phase as follows: 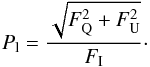 (3)Here, FQ and FU are the linear polarization components of the Stokes vector where FI is the intensity component. The circular polarization component FV is negligible in our scenarios, compared to the linear components and, therefore, not considered in subsequent discussions. Owing to the characteristics of the Stokes vector, the degree of polarization only provides information about the magnetic field components in the plane of sky (POS).
3.2. Bok globule mass
We begin our investigations with the influence of the Bok globule mass and, therefore, the optical depth on the polarized emission of Bok globules. For this purpose, we simulate the thermal emission of our reference model with total masses of Mgas = { 8,12,16,20,24,28,32,36,40 } M⊙. These total masses correspond to the following optical depths: 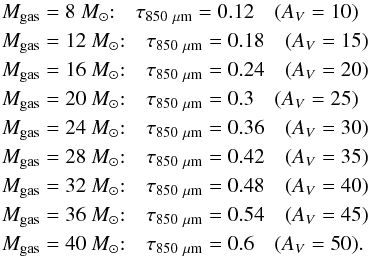 Here, the optical depth is derived for the distance between the centre and the boundary of our Bok globule model (λ = 850 μm). Figure 1 illustrates the degree of polarization vs. the normalized intensity. Within the chosen mass range, the optical depth effect decreases the degree of polarization by about 2% to 10%. Compared with observations, this decrease amounts to about 10% to 70% of the decrease as seen in observations (see Fig. 2). This result appears to be in contrast to the RAT theory that causes a better alignment of the dust grains close to the radiation source. However, the degree of polarization depends not only on the alignment of dust grains but also, for instance, on the optical depth as seen in Fig. 1.
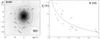 |
Fig. 2 Left: SCUBA 850 μm maps of B335 with polarization vectors superimposed. The length of the vectors is proportional to the degree of polarization and the direction gives the position angle. The data are binned over 9′′. Only vectors for which the 850 μm flux exceeds 5 times the standard deviation and Pl/σ(Pl) > 3 are plotted. The contour lines mark 20%, 40%, 60%, and 80% of the maximum intensity. Right: scatter diagrams showing the distribution of Pl vs. intensity I across the Bok globule B335. Only data points in which the 850 μm flux exceeds 5 times the standard deviation and Pl/σ(Pl) > 3 have been considered. (Wolf et al. 2003; DOI:10.1086/375622;c ◯AAS. Reproduced with permission.) |
3.3. Influence of the optical depth
Since the optical depth has a great influence on the polarized emission of Bok globules, we analyse how the optical depth influences linear polarization in general. For this, we have to adjust our reference model to feature optically thin, as well as optically thick line-of-sights. Therefore, we consider a total mass of Mgas = 40 M⊙ and simulate the thermal emission at λ = 450 μm. Figure 3 illustrates a strong variation in the degree of polarization, which can be explained with the optical properties of elongated dust grains.
The average thermal emission of an elongated dust grain can be split into a component of the longer ⊥ and the shorter ∥ axis:  Here,
Here,  is the blackbody radiation, σgeo is the projected geometrical surface area, and
  is the absorption cross-section of the selected axis. After travelling a given distance, the radiation of elongated dust grains decreases as follows:
  where the optical depth τ is defined as
  Here,
Here,  is the extinction cross-section parallel or perpendicular to the shorter axis of the first dust grain and ndust is the dust grain number density. If we assume that each dust grain has the same orientation, composition, and extent in the model space (constant cross-sections),
  can be derived as follows:
 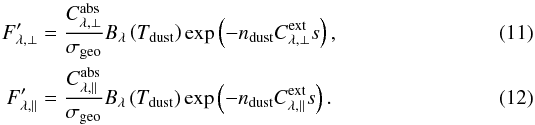 With Eqs. (11) and (12), we can find the critical distance at which the polarization is zero (
 ).
).  (13)The work of Reissl et al. (2014) shows a similar analysis, but focuses on the sign change of the Stokes vector Q-component instead of the critical distance.
 |
Fig. 3 Polarization map of the thermal emission of our reference model with a total mass of Mgas = 40 M⊙ inside of R = 1.5 × 10⁴ AU (λ = 450 μm). The image shows the innermost 80′′ × 80′′ (corresponding to 8000 AU × 8000 AU). The orientation of the white lines show the polarization angle and their length show the degree of polarization. The white dashed contour line shows the line-of-sight optical depth τLOS = 1. The orientation of the magnetic field lines is parallel to the y-axis. |
 |
Fig. 4 Schematic illustration of the interaction between polarized thermal emission of an elongated prolate dust grain (orange) and their dichroic extinction (black). This illustration is also valid for oblate dust grains, because the key effect is the same. E is the electric field vector component parallel or perpendicular to the magnetic field B. The critical distance scrit is taken from Eq. (13), Pl is the degree of polarization and θ is the polarization angle relative to the x-axis. The radiation of the absorbing dust grains (black) is not taken into account. |
If we use the cross-sections of our dust grain model, scrit corresponds to an optical depth in the order of about one but always lower than one. The quantity scritndust becomes unity in the limit of spherical dust grains, which is expected from analytical considerations (Poisson distribution).
Therefore, we can distinguish three different cases for the polarized emission of an elongated dust grain (see Fig. 4). If s<scrit, the dichroic emission dominates the degree of polarization. With s = scrit, the dichroic emission and extinction compensate each other and the degree of polarization is zero. In the case of s>scrit, the dichroic extinction increases the degree of polarization again and rotates the polarization angle by 90°. The precise value of τcrit depends on the distribution, orientation, and geometrical shape of the dust grains.
A significant decrease in the degree of polarization is therefore achievable with a line-of-sight optical depth in the order of one.
3.4. Dust grain size
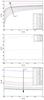 |
Fig. 5 Distribution of the mean degree of polarization Pl vs. the intensity FI across the Bok globule models. The intensity FI is normalized to the maximum intensity F0 of the respective Bok globule. The Bok globule models have different maximum dust grain sizes from amax = 2 μm to amax = 2000 μm. The distributions are split in three images to outline the different behaviour of the polarization degree. |
Besides the dust mass, the dust grain size is also expected to have a great impact on several characteristics of a Bok globule. For instance, the absorption and extinction cross-sections are highly dependent on the dust grain size (distribution) and influence the optical depth (see Eqs. (9) and (10)). The radiative torque alignment is also sensitive to the size of the dust grains. We therefore investigate the influence of different dust grain size distributions on the behaviour of the degree of polarization in Bok globules. For this purpose, we simulate our reference model using different maximum dust grain sizes amax ∈ { 2,...,200,...,2000 } μm. These maximum dust grain sizes correspond to the following optical depths: 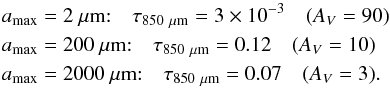 Here, the optical depth is derived for the distance between the centre and the boundary of our Bok globule model (Mgas = 8 M⊙, λ = 850 μm).
As illustrated in Fig. 5 (top), the distribution of the degree of polarization vs. intensity shows between amax ~ 2 μm and amax ~ 30 μm a maximum in the high intensity central region and a significant decrease towards the outer low intensity parts of the Bok globule. Even up to amax ~ 80 μm, no polarization hole can be seen in the profile (see Fig. 5, middle). Polarization holes only occur with dust grains above amax ~ 80 μm (see Fig. 5, bottom). Furthermore, these threshold values of the maximum dust grain size hardly depend on the total Bok globule mass.
As illustrated in Fig. 5 (bottom), dust grain size distributions with amax> 80 μm generally decrease the degree of polarization of the Bok globule model with increasing size. According to the work of Weidenschilling & Ruzmaikina (1994), the densest regions in Bok globules are expected to consist of larger dust grains than the less dense regions. For instance, with dust grains up to a few 100 μm in the centre of the Bok globule model and grains smaller than 10 μm in the surroundings, a difference of the degree of polarization of P ~ 10% can be achieved.
3.5. Dust grain composition
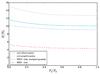 |
Fig. 6 Distribution of the mean degree of polarization Pl vs. the intensity FI across the Bok globule models. The intensity FI is normalized to the maximum intensity F0 of the respective Bok globule. The dust grains in the Bok globule models consist only of silicate, graphite, MRN-dust or MRN-dust with unaligned graphite grains. |
The composition of dust grains in Bok globules is not exactly known and may be different in the Bok globule core and envelope (Olofsson & Olofsson 2011). As used in the reference model, the MRN-dust composition is a popular choice which is in agreement with many observations. However, the ratio between silicate and graphite grains does not need to be the same in every part of a Bok globule. To investigate the influence of the relative abundance on the degree of polarization, we simulate the reference model with MRN-dust and dust grains that consist of only one component. As illustrated in Fig. 6, graphite grains cause an overall higher degree of polarization and a slightly stronger decrease in the degree of polarization than silicate grains.
Olofsson & Olofsson (2011) mention that the dust phase in the centre of the Bok globule B335 consists of much more graphite grains than the surroundings. This may also occur in other Bok globules and increase in the degree of polarization towards the higher amount of graphite grains. In that case, mechanisms which cause polarization holes in Bok globules need to compensate for the influence of the higher amount of aligned graphite grains. However, this impact of the graphite grains is only true as long as they align with the magnetic field, which is proposed by the works of Clayton et al. (2003) and Draine & Li (2007). In contrast, Mathis (1986), Lazarian (2007), Andersson et al. (2015) mentioned that graphite grains do not align with the magnetic field. If the latter statement is correct, the degree of polarization decreases in regions with a higher amount of graphite grains, which supports polarization holes. For instance, taking MRN-composition in the central region of the Bok globule model and pure silicate in the surroundings into account, the decrease in the degree of polarization amounts to ~5% (see Fig. 6).
3.6. Radiative torque alignment
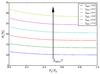 |
Fig. 7 Distribution of the mean degree of polarization Pl vs. the intensity FI across the Bok globule models. The intensity FI is normalized to the maximum intensity F0 of the respective Bok globule. The Bok globule models have different values of fhigh,J from 0.0 to 1.0 in 0.2 steps. |
As described in Sect. 2.5, the efficiency of the radiative torque alignment depends strongly on the free parameter fhigh,J. To estimate a potential influence on the optical depth effect and the degree of polarization in general, we simulate our reference model using values of fhigh,J from 0 to 1.0 in 0.2 steps. As predicted, an increase in fhigh,J causes a great increase in the degree of polarization (see Fig. 7). Nevertheless, the relative decrease in the degree of polarization does not change through variations in fhigh,J.
Polarimetric observations of Bok globules show a degree of polarization of P ~ 15% in their outer regions (see e.g. Henning et al. 2001). We therefore estimate that the mean value of fhigh,J is less than 0.4 in Bok globules, which is in agreement with the results of Hoang & Lazarian (2008).
As mentioned in Sect. 2.5, a constant value of fhigh,J in the whole Bok globule is not expected in reality. A spatial variation in fhigh,J is more suitable for taking variations in the temperature and density distribution into account. Because of the high temperature and density in the centre of Bok globules, a lower ratio of fast to low spinning dust grains is reasonable. As illustrated in Fig. 7, a lower value of fhigh,J in the dense regions of Bok globules would decrease the degree of polarization. This effect is similar to the explanation of increased disalignment owing to higher temperature and density, but can now be explained by fewer dust grains, which rotate at high angular momentum considering the RAT theory.
3.7. Bok globules with no central protostar
Some Bok globules have starless cores instead of one or more central protostars (Launhardt et al. 2010). With our present results, we discuss the effect of a missing central protostar on the degree of polarization.
The critical distance scrit of the optical depth effect depends mainly on the alignment efficiency in the most massive regions (see Influence of the optical depth in Sect. 3.3). Without a central protostar, these regions, which are mainly the core of a Bok globule, are not well irradiated by an external radiation source and, therefore, not efficiently aligned by the RAT mechanism. As a result, the emission of the core is not strongly polarized and the aforementioned optical depth effect is rather weak. However, since the dust grains in the core are not well aligned, the degree of polarization is still decreasing towards the dense regions of Bok globules. Thus, we expect that the polarized emission of Bok globules with or without a central protostar show the same trend, but based on different underlying physical effects.
3.8. Further investigations
At shorter wavelengths (e.g. λ = 450 μm), the line-of-sight optical depth increases which influences the degree of polarization as described in Sect. 3.3 (see Fig. 3). Observations of Bok globules at shorter wavelengths could be used to constrain the impact of the optical depth effect on the degree of polarization. The images in Fig. 8 show the difference between the polarization maps at λ = 450 μm and λ = 850 μm of our reference model using different total masses. A large difference of the linear polarization can be related to a great impact of the optical depth effect at λ = 850 μm (Fig. 8, middle). This impact is even greater if the degree of polarization is in the same order of magnitude at both wavelengths, but has its orientation shifted by 90° (Fig. 8, bottom).
A possible observation could be performed with SCUBA-2/JCMT at λ = 450 μm. From simulations of our reference model, we obtain a required sensitivity of  to resolve the important inner region of the Bok globule (Wardle & Kronberg 1974; Wolf et al. 2002):
  (14)Here, Δγ is the required resolution of the polarization angle, FI the Intensity and Pl the degree of polarization. Taking the Daisy map (field of view of ~3′) and standard values for weather and airmass of the SCUBA-2 Integration Time Calculator (Holland et al. 2013) into consider, we derive an observation time of about two hours and 15 min.
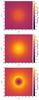 |
Fig. 8 Difference images between the thermal emission linear polarization maps of our reference model observed at λ = 450 μm and λ = 850 μm (top: Mgas = 12 M⊙, middle: Mgas = 24 M⊙, bottom: Mgas = 32 M⊙). The images show the innermost 80′′ × 80′′ (corresponding to 8000 AU × 8000 AU). |
4. Conclusions
We investigated the influence of various physical conditions and quantities on the occurrence of polarization holes in Bok globules and the degree of polarization in general. Under selected circumstances, we found that variations in the optical depth, the dust grain size, and the dust grain composition significantly influence the degree of polarization in Bok globules.
The conditions under which the optical depth significantly decreases the degree of polarization are summarised as follows:
-
1.
Dust grain growth to submm/mm size The absorption cross-section of dust grains grown to 80 μm or less (spectral index of > 3 or β> 1) is too low, in combination with typical column densities of Bok globules, to cause a significant decrease in the degree of polarization. However, dust grains grown to submm/mm size are able to decrease the polarization and are consistent with the spectral index derived from observed fluxes of various Bok globules at λ = 850 μm and λ = 1.3 mm (τ< 3 or β< 1).
-
2.
Hydrogen column density of NH ~ 1028m-2 Given the dust grain growth above, the column density needs to be in the order of magnitude of about 1028 m-2 to decrease the degree of polarization by up to ΔP ~ 10 %. This corresponds to a total mass of some 10 M⊙ inside of 1.5 × 104 AU × 1.5 × 104 AU which is in agreement with masses found for Bok globules.
The following physical quantities and conditions are also able to significantly decrease the degree of polarization in Bok globules:
-
1.
Larger dust grains limited to dense regions A gradient of the dust grain size towards submm/mm grains in the dense regions of Bok globules is able to decrease the degree of polarization by up to ΔP ~ 10 %.
-
2.
Unaligned graphite grains accumulated in dense regions The combination of graphite grains that are not aligned with the magnetic field and a higher amount of graphite grains in dense regions of Bok globules is able to decrease the degree of polarization by up to ΔP ~ 5%.
-
3.
Less efficient grain alignment in the central region If the higher density and temperature in the dense regions of Bok globules reduce the amount of dust grains that rotate at high angular momentum, the degree of polarization decreases by up to ΔP ~ 10 % by applying the RAT theory and assuming fhigh,J< 0.4.
-
4.
No central stellar heating source In Bok globules without a central stellar heating source, the degree of polarization is expected to decrease similarly to Bok globules with a heating source. This is caused by the low alignment efficiency in the central dense core, which is due to the weak irradiation from external radiation sources.
In addition to increased disalignment and twisted magnetic field lines, we found that the above conditions (optical depth, dust grain size, and dust grain composition) provide an explanation for the significant decrease in linear polarization towards dense regions of Bok globules. Given typical physical conditions in Bok globules, several effects are likely to cause the observed polarization holes together.
Acknowledgments
Part of this work was supported by the German Deutsche Forschungsgemeinschaft, DFG project number WO 857/12-1.
References
- Andersson, B.-G., Lazarian, A., & Vaillancourt, J. E. 2015, ARA&A, 53, 501 [NASA ADS] [CrossRef] [Google Scholar]
- Barnett, S. J. 1915, Phys. Rev., 6, 239 [CrossRef] [Google Scholar]
- Bertrang, G., Wolf, S., & Das, H. S. 2014, A&A, 565, A94 [NASA ADS] [CrossRef] [EDP Sciences] [Google Scholar]
- Bok, B. J. 1977, PASP, 89, 597 [NASA ADS] [CrossRef] [Google Scholar]
- Bok, B. J., & Reilly, E. F. 1947, ApJ, 105, 255 [NASA ADS] [CrossRef] [Google Scholar]
- Clayton, G. C., Wolff, M. J., Sofia, U. J., Gordon, K. D., & Misselt, K. A. 2003, ApJ, 588, 871 [NASA ADS] [CrossRef] [Google Scholar]
- Clemens, D. P., Yun, J. L., & Heyer, M. H. 1991, ApJS&S, 75, 877 [NASA ADS] [CrossRef] [Google Scholar]
- Davis, Jr., L., & Greenstein, J. L. 1951, ApJ, 114, 206 [Google Scholar]
- Draine, B. T., & Flatau, P. J. 2013, ArXiv e-prints [arXiv:1305.6497] [Google Scholar]
- Draine, B. T., & Li, A. 2007, ApJ, 657, 810 [NASA ADS] [CrossRef] [Google Scholar]
- Evans, II, N. J., Lee, J.-E., Rawlings, J. M. C., & Choi, M. 2005, ApJ, 626, 919 [NASA ADS] [CrossRef] [Google Scholar]
- Federrath, C. 2015, MNRAS, 450, 4035 [NASA ADS] [CrossRef] [Google Scholar]
- Glenn, J., Walker, C. K., & Young, E. T. 1999, ApJ, 511, 812 [NASA ADS] [CrossRef] [Google Scholar]
- Gold, T. 1952, MNRAS, 112, 215 [NASA ADS] [Google Scholar]
- Goodman, A. A., Jones, T. J., Lada, E. A., & Myers, P. C. 1992, ApJ, 399, 108 [Google Scholar]
- Henning, T., Wolf, S., Launhardt, R., & Waters, R. 2001, ApJ, 561, 871 [NASA ADS] [CrossRef] [Google Scholar]
- Hildebrand, R. H., Dotson, J. L., Dowell, C. D., Schleuning, D. A., & Vaillancourt, J. E. 1999, ApJ, 516, 834 [NASA ADS] [CrossRef] [Google Scholar]
- Hoang, T., & Lazarian, A. 2008, MNRAS, 388, 117 [NASA ADS] [CrossRef] [Google Scholar]
- Hoang, T., & Lazarian, A. 2009, ApJ, 695, 1457 [NASA ADS] [CrossRef] [Google Scholar]
- Hoang, T., & Lazarian, A. 2014, MNRAS, 438, 680 [NASA ADS] [CrossRef] [Google Scholar]
- Holland, W. S., Bintley, D., Chapin, E. L., et al. 2013, MNRAS, 430, 2513 [NASA ADS] [CrossRef] [Google Scholar]
- Jones, R. V., & Spitzer, Jr., L. 1967, ApJ, 147, 943 [NASA ADS] [CrossRef] [Google Scholar]
- Kaminski, E., Frank, A., Carroll, J., & Myers, P. 2014, ApJ, 790, 70 [NASA ADS] [CrossRef] [Google Scholar]
- Launhardt, R., Nutter, D., Ward-Thompson, D., et al. 2010, ApJS, 188, 139 [NASA ADS] [CrossRef] [Google Scholar]
- Lazarian, A. 1995, ApJ, 451, 660 [NASA ADS] [CrossRef] [Google Scholar]
- Lazarian, A. 2007, J. Quant. Spec. Radiat. Transf., 106, 225 [NASA ADS] [CrossRef] [Google Scholar]
- Lazarian, A., & Hoang, T. 2007, MNRAS, 378, 910 [Google Scholar]
- Lazarian, A., & Roberge, W. G. 1997, ApJ, 484, 230 [NASA ADS] [CrossRef] [Google Scholar]
- Leung, C. M. 1985, in Protostars and Planets II, eds. D. C. Black, & M. S. Matthews, 104 [Google Scholar]
- Mathis, J. S. 1986, ApJ, 308, 281 [NASA ADS] [CrossRef] [Google Scholar]
- Mathis, J. S., Rumpl, W., & Nordsieck, K. H. 1977, ApJ, 217, 425 [NASA ADS] [CrossRef] [Google Scholar]
- Matsumura, M., Kameura, Y., Kawabata, K. S., et al. 2011, PASJ, 63, L43 [NASA ADS] [Google Scholar]
- Matthews, B. C. 2005, in Astronomical Polarimetry: Current Status and Future Directions, eds. A. Adamson, C. Aspin, C. Davis, & T. Fujiyoshi, ASP Conf. Ser., 343, 99 [Google Scholar]
- Matthews, B. C., & Wilson, C. D. 2002, ApJ, 574, 822 [NASA ADS] [CrossRef] [Google Scholar]
- Natta, A., Testi, L., Calvet, N., et al. 2007, Protostars and Planets V, 767 [Google Scholar]
- Olofsson, S., & Olofsson, G. 2009, A&A, 498, 455 [NASA ADS] [CrossRef] [EDP Sciences] [Google Scholar]
- Olofsson, S., & Olofsson, G. 2011, A&A, 534, A127 [NASA ADS] [CrossRef] [EDP Sciences] [Google Scholar]
- Pudritz, R. E., Klassen, M., Kirk, H., Seifried, D., & Banerjee, R. 2014, in IAU Symp., 302, 10 [Google Scholar]
- Purcell, E. M. 1979, ApJ, 231, 404 [NASA ADS] [CrossRef] [Google Scholar]
- Rao, R., Crutcher, R. M., Plambeck, R. L., & Wright, M. C. H. 1998, ApJ, 502, L75 [NASA ADS] [CrossRef] [Google Scholar]
- Reissl, S., Wolf, S., & Seifried, D. 2014, A&A, 566, A65 [NASA ADS] [CrossRef] [EDP Sciences] [Google Scholar]
- Reissl, et al. 2016, submitted [Google Scholar]
- Seifried, D., & Walch, S. 2015, MNRAS, 452, 2410 [NASA ADS] [CrossRef] [Google Scholar]
- Van Loo, S., Tan, J. C., & Falle, S. A. E. G. 2015, ApJ, 800, L11 [NASA ADS] [CrossRef] [Google Scholar]
- Wardle, J. F. C., & Kronberg, P. P. 1974, ApJ, 194, 249 [NASA ADS] [CrossRef] [Google Scholar]
- Weidenschilling, S. J., & Ruzmaikina, T. V. 1994, ApJ, 430, 713 [NASA ADS] [CrossRef] [Google Scholar]
- Weingartner, J. C., & Draine, B. T. 2001, ApJ, 548, 296 [NASA ADS] [CrossRef] [Google Scholar]
- Wolf, S., & Voshchinnikov, N. V. 2004, Comp. Phys. Comm., 162, 113 [NASA ADS] [CrossRef] [Google Scholar]
- Wolf, S., Vanzi, L., & Ageorges, N. 2002, The Polarimetric Mode of SOFI, ESO Doc. No. LSO-TREESO-40200-1060 [Google Scholar]
- Wolf, S., Launhardt, R., & Henning, T. 2003, ApJ, 592, 233 [NASA ADS] [CrossRef] [Google Scholar]
- Wolf, S., Launhardt, R., & Henning, T. 2004, Ap&SS, 292, 239 [NASA ADS] [CrossRef] [Google Scholar]
All Tables
Overview of dust grain growth in selected Bok globules with one or more polarization holes.
All Figures
|
Fig. 1 Distribution of the mean degree of polarization Pl vs. the intensity FI across the Bok globule models. The intensity FI is normalized to the maximum intensity F0 of the respective Bok globule. The Bok globule models have total masses of Mgas = { 8,12,16,20,24,28,32,36,40 } M⊙ inside of R = 1.5 × 10⁴ AU (λ = 850 μm). |
| In the text | |
|
Fig. 2 Left: SCUBA 850 μm maps of B335 with polarization vectors superimposed. The length of the vectors is proportional to the degree of polarization and the direction gives the position angle. The data are binned over 9′′. Only vectors for which the 850 μm flux exceeds 5 times the standard deviation and Pl/σ(Pl) > 3 are plotted. The contour lines mark 20%, 40%, 60%, and 80% of the maximum intensity. Right: scatter diagrams showing the distribution of Pl vs. intensity I across the Bok globule B335. Only data points in which the 850 μm flux exceeds 5 times the standard deviation and Pl/σ(Pl) > 3 have been considered. (Wolf et al. 2003; DOI:10.1086/375622;c ◯AAS. Reproduced with permission.) |
| In the text | |
|
Fig. 3 Polarization map of the thermal emission of our reference model with a total mass of Mgas = 40 M⊙ inside of R = 1.5 × 10⁴ AU (λ = 450 μm). The image shows the innermost 80′′ × 80′′ (corresponding to 8000 AU × 8000 AU). The orientation of the white lines show the polarization angle and their length show the degree of polarization. The white dashed contour line shows the line-of-sight optical depth τLOS = 1. The orientation of the magnetic field lines is parallel to the y-axis. |
| In the text | |
|
Fig. 4 Schematic illustration of the interaction between polarized thermal emission of an elongated prolate dust grain (orange) and their dichroic extinction (black). This illustration is also valid for oblate dust grains, because the key effect is the same. E is the electric field vector component parallel or perpendicular to the magnetic field B. The critical distance scrit is taken from Eq. (13), Pl is the degree of polarization and θ is the polarization angle relative to the x-axis. The radiation of the absorbing dust grains (black) is not taken into account. |
| In the text | |
|
Fig. 5 Distribution of the mean degree of polarization Pl vs. the intensity FI across the Bok globule models. The intensity FI is normalized to the maximum intensity F0 of the respective Bok globule. The Bok globule models have different maximum dust grain sizes from amax = 2 μm to amax = 2000 μm. The distributions are split in three images to outline the different behaviour of the polarization degree. |
| In the text | |
|
Fig. 6 Distribution of the mean degree of polarization Pl vs. the intensity FI across the Bok globule models. The intensity FI is normalized to the maximum intensity F0 of the respective Bok globule. The dust grains in the Bok globule models consist only of silicate, graphite, MRN-dust or MRN-dust with unaligned graphite grains. |
| In the text | |
|
Fig. 7 Distribution of the mean degree of polarization Pl vs. the intensity FI across the Bok globule models. The intensity FI is normalized to the maximum intensity F0 of the respective Bok globule. The Bok globule models have different values of fhigh,J from 0.0 to 1.0 in 0.2 steps. |
| In the text | |
|
Fig. 8 Difference images between the thermal emission linear polarization maps of our reference model observed at λ = 450 μm and λ = 850 μm (top: Mgas = 12 M⊙, middle: Mgas = 24 M⊙, bottom: Mgas = 32 M⊙). The images show the innermost 80′′ × 80′′ (corresponding to 8000 AU × 8000 AU). |
| In the text | |
Current usage metrics show cumulative count of Article Views (full-text article views including HTML views, PDF and ePub downloads, according to the available data) and Abstracts Views on Vision4Press platform.
Data correspond to usage on the plateform after 2015. The current usage metrics is available 48-96 hours after online publication and is updated daily on week days.
Initial download of the metrics may take a while.