| Issue |
A&A
Volume 588, April 2016
|
|
|---|---|---|
| Article Number | A72 | |
| Number of page(s) | 4 | |
| Section | Planets and planetary systems | |
| DOI | https://doi.org/10.1051/0004-6361/201527482 | |
| Published online | 21 March 2016 | |
Research Note
HCN observations of comets C/2013 R1 (Lovejoy) and C/2014 Q2 (Lovejoy)
1
Department of Earth and Space SciencesChalmers University of Technology,
Onsala Space Observatory,
439 92
Onsala,
Sweden
e-mail:
This email address is being protected from spambots. You need JavaScript enabled to view it.
2
Department of Chemistry and Chemical Engineering, Chalmers
University of Technology, 412
96
Gothenburg,
Sweden
3
Department of Applied Physics, Chalmers University of
Technology, 412
96
Gothenburg,
Sweden
Received: 30 September 2015
Accepted: 18 February 2016
Abstract
HCN J = 1–0 emission from the long-period comet C/2013 R1 (Lovejoy) was observed from the Onsala Space Observatory on multiple occasions during the month before its perihelion passage on December 22, 2013. We report detections for seven different dates, spanning heliocentric distances (Rh) decreasing from 0.94 to 0.82 au. Estimated HCN production rates are generally higher than previously reported for the same time period, but the implied increase in production rate with heliocentric distance, QHCN ∝ Rh-3.2, represent well the overall documented increase since it was first observed at Rh = 1.35. The implied mean HCN abundance relative to water in R1 Lovejoy is 0.2%. We also report on a detection of HCN with the new 3 mm receiver system at Onsala Space Observatory in comet C/2014 Q2 (Lovejoy) on January 14, 2015, when its heliocentric distance was 1.3 au. Relative to comet C/2013 R1 (Lovejoy), the HCN production rate of C/2014 Q2 (Lovejoy) was more than 5 times higher at similar heliocentric distances, and the implied HCN abundance relative to water 0.09%.
Key words: comets: individual: C/2013 R1 (Lovejoy) / comets: individual: C/2014 Q2 (Lovejoy) / radio lines: planetary systems / comets: general
© ESO, 2016
1. Introduction
Comets, bodies composed of molecular ices and crystalline silicate dust, were formed far out from the Sun in the young solar system, and the vast majority have remained there ever since. Their compositions can therefore provide clues to the local conditions during the formation of the solar system (Mumma & Charnley 2011; Bockelée-Morvan et al. 2004). When a cometary orbit is perturbed, bringing it within about 3 au from the Sun, the ices in its nucleus sublimate to form a coma of gaseous volatiles and dust, allowing for remote investigations of their composition. Spectroscopic investigations at infrared (e.g. DiSanti et al. 2013) and radio wavelengths (e.g. Remijan et al. 2008; Biver et al. 2012) have revealed a wide chemical diversity among comets. Thus, detailed studies of cometary comae are essential to explore the extent of heterogeneity amongst comets, and provide further understanding of the distribution of molecular material throughout the solar system during its formation.
The water production rate of a comet is expected to scale approximately as  , where Rh is the comet’s radial distance to the Sun. HCN is one of the cometary molecules whose production rate follows most closely that of water, typically with a mixing ratio close to 0.1%; therefore, this molecule is commonly used as a proxy to the water production rate (Mumma & Charnley 2011). By combining observations of HCN over a range of heliocentric distances, the production rate variability can be studied and possibly connected to outgassing mechanisms, physical structure, and distribution of volatiles near the nucleus surface.
We report on observations of hydrogen cyanide (HCN) in comet C/2013 R1 (Lovejoy) (hereafter referred to as R1 Lovejoy) and C/2014 Q2 (Lovejoy) (hereafter Q2 Lovejoy). Comet R1 Lovejoy is a high-inclination (i = 64°), long-period comet with orbital period of about 7000 yr. It was discovered by Terry Lovejoy on September 7, 2013 at a heliocentric distance of 1.98 au (Lovejoy et al. 2013), and passed perihelion at 0.81 au on December 22, 2013. Comet Q2 Lovejoy was also discovered by Terry Lovejoy, almost a year later on August 17, 2014 (Lovejoy et al. 2014), at a heliocentric distance of 2.63 au. Comet Q2 Lovejoy is also a long-period, high-inclination (i ~ 80°) comet that reached perihelion on January 30, 2015, at a closest heliocentric distance of 1.29 au.
Summary of observations and results.
2. Observations and data reduction
The J = 1–0 transition of HCN at 88.63 GHz was observed towards comet C/2013 R1 (Lovejoy) using the 3 mm receiver at the Onsala Space Observatory 20 m antenna (OSO20 m) on multiple occasions during November and December 2013. At the time of observations, comet R1 Lovejoy was approaching perihelion, but receding from Earth. The geometric circumstances for the observing dates are included in Table 1.
A frequency switching mode with a switching frequency of 5 Hz and a throw of 5 MHz was used, and spectra were recorded with a 1600 channel correlator at channel separation 12.5 kHz, thus providing 20 MHz bandwidth. Before each observing session, tabulated hourly ephemerides from the latest available solution were obtained from the Jet Propulsion Laboratory Horizons system1, which were then interpolated by the telescope control system. The pointing accuracy was typically checked after sunrise and sunset, and its magnitude was not found to vary significantly between observing days. Pointing offsets of less than 5′′ were found and applied to the pointing model, which has an rms of 3′′. The system temperature varied from 300 K and up during and between the observing days; we excluded spectra with system temperatures above 1000 K from the data set. The total integration times for spectra included in the analysis for each day are given in Table 1. Baselines of polynomial order 3, 5, or 7 were fitted to individual spectra and subtracted before averaging spectra using the recorded system temperatures as weights.
The same transition of HCN was observed toward comet C/2014 Q2 (Lovejoy) on January 14, 2015, but with the new dual-polarisation, sideband-separating 3 mm receiver system2 (Belitsky et al. 2015) in dual beam-switching mode (DBSW) with secondary beam offset 11′. The system temperature varied between 140–400 K and spectra were recorded with a fast Fourier transform spectrometer at channel separation 12.2 kHz, covering 100 MHz bandwidth. The use of DBSW, together with the fact that the new system is more stable, made it sufficient to fit and subtract linear baselines from individual spectra before averaging with the same method as for R1 Lovejoy.
At 88.6 GHz the OSO20 m beam full width at half maximum (FWHM) is about 44′′ corresponding to about 1.3–2.5 × 10⁴ km at the distance of comet R1 Lovejoy and 1.6 × 10⁴ km at the distance of Q2 Lovejoy during observations. The main beam efficiency is about 0.53 at this frequency. Before analysis and presentation, reduced spectra were redressed to a channel spacing of 0.2 km s-1.
3. Results and analysis
3.1. R1 Lovejoy
The main beam intensities, integrated over all three HCN hyperfine components and with associated 1σ errors, are given in Table 1 for each observing day, and Fig. 1 shows the total average R1 Lovejoy HCN spectrum including data from all of the observing dates. The two strongest hyperfine components show clear double peaks. However, the relative intensities are fairly similar so no conclusions can be drawn about outgassing asymmetries.
 |
Fig. 1 HCN total average spectrum for C/2013 R1 (Lovejoy), including data from all detection days. The three hyperfine components are indicated with arrows. |
No temperature information can be derived from the current dataset. However, based on observations of a set of methanol rotational transitions around 251 GHz, Biver et al. (2014) report on the coma kinetic temperatures for R1 Lovejoy on November 8 (55 K), November 27 (65 K), and December 9 (80 K), 2013. These data from concurrent observations at a similar frequency, thus probing the same part of the coma, should provide appropriate estimates of the excitation conditions for HCN. As the relation between the three reported temperatures are not at all well described by a power law, the coma kinetic temperatures on the dates of observations are approximated by linear interpolations between adjacent data points; see Table 1. The water production rates, Q(H2O), presented in Table 1 are derived, using the same method, from the published water production rates in Biver et al. (2014). Spectroscopic parameters for HCN in its vibrational ground state are adopted from the Cologne Database for Molecular Spectroscopy3 (Müller et al. 2005), and the HCN 1–0 emission is assumed to be optically thin, as verified by the ratio of line intensities.
3.1.1. Column densities and production rates
The rotational excitation of molecules is dominated by collisions in the inner parts of the coma, but with increasing distance from the nucleus, densities decline and radiative processes become more important. For HCN, the excitation cannot be assumed to be thermalised beyond radii of 5 × 10³ km (Bockelée-Morvan et al. 2004); this means that local thermodynamical equilibrium (LTE) analysis of the current observations, sampling coma gas out to ~104 km, is inadequate.
Therefore, to estimate the HCN production rate, QHCN, and beam averaged column densities, we used the excitation and radiative transfer model described in Biver et al. (1999). The model assumes a spherically symmetric Haser model for the density distribution of molecules in the coma, and considers collisional excitation by water and electrons, as well as radiative excitation. It assumes a density distribution of parent molecules in the cometary coma that is proportional to Qe− r/ (vexptl)/ (vexpr2), where vexp is the constant gas expansion velocity and tl is the lifetime of the molecule. In this model, the excitation ranges from collision domination in the inner part of the coma, to domination by the balance between solar pumping and spontaneous decay at large enough radii. For more details, for example, on collision rates and excitation models that were used, see Biver et al. (1999) and references therein.
The gas expansion velocity is expected to increase as the comet approaches the Sun, but no such trend could be securely determined from our dataset. Instead, it was taken as constant and estimated from the line profiles in the total averaged spectrum shown in Fig. 1, namely as the average of the half-widths at half-maximum intensity (HWHM) for the two strongest hyperfine line components, giving vexp = 1.1 ± 0.1 km s-1. Since HCN lifetimes are sensitive to solar activity (Bockelee-Morvan & Crovisier 1985), and the observations were carried out at a time of moderate solar activity, a photodissociation rate of 2.0 × 10⁻⁵ s-1 was adopted based on Crovisier (1994), following the example of Biver et al. (2000). This rate was scaled based on the average heliocentric distance for each observing day. The resulting HCN production rates fall between 0.7 and 2.4 × 1026 molecules per second and are listed in the rightmost column of Table 1.
3.2. Q2 Lovejoy
Figure 2 shows the total averaged HCN spectrum toward Q2 Lovejoy and the resulting integrated intensity is included in Table 1. The signal is stronger than for any of the dates R1 Lovejoy was observed; all three hyperfine components are clearly detected at the expected line ratios of 1:5:3. Moreover, the measured integrated intensity is more than twice what we measure for R1 Lovejoy at any date, although Q2 Lovejoy at the time of observation was further from both the Sun and the Earth. The noise level reached in just above six hours on-source time with the new receiver system is similar to what was obtained from more than 10 hours of on-source time for R1 Lovejoy in 2013.
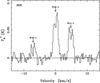 |
Fig. 2 Average HCN spectrum for C/2014 Q2 (Lovejoy) on January 14, 2015. The three hyperfine components are indicated with arrows. |
From observations of a suite of methanol lines between January 13–26 2015, Biver et al. (2015) derive a gas kinetic temperature of 73 K for the coma of comet Q2 Lovejoy. The study also provides a water production rate of 5 × 1029 molecules s-1 for January 13–16, 2015. Adopting an expansion velocity of 0.82 ± 0.04 km s-1 from the line profile, the HCN production rate is then estimated at 4.5 × 1026 molecules per second (see Table 1) using the same model as for R1 Lovejoy.
4. Discussion
While the chemical reactions taking place in a cometary coma can play an important role in the radial distribution of molecules (Rodgers & Charnley 2005), HCN is considered mainly a parent species, originating from the nucleus itself. Recent Atacama Large Millimiter Array (ALMA) spectral maps of the HCN distribution in two cometary comae are indeed consistent with centrally peaked, symmetric distributions (Cordiner et al. 2014), further supporting its designation as a parent species. This, together with the observed double-peaked line profiles, to some extent validates the use of the homogeneously expanding Haser model for estimating the HCN production rates presented here.
4.1. R1 Lovejoy
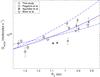 |
Fig. 3 HCN production rates as a function of heliocentric distance for comet C/2013 R1 Lovejoy. Error bars shown for the current data (crosses) do not include uncertainties in model parameters, but only reflect measurement errors. Circles represent data from Paganini et al. (2014), stars data from Agúndez et al. (2014), and triangles data from Biver et al. (2014). The solid line illustrates the best fit to the current data, |


Figure 3 shows our estimated HCN production rates in relation to previously published rates, as a function of heliocentric distance. Our production rates are consistent with an increase in activity with decreasing heliocentric distance, best fit by the power-law function  s-1, shown as a solid line in Fig. 3. Compared to production rates reported by Biver et al. (2014) from the same period of time (the errorbars of the Biver et al. dataset are too small to display at the scale of the plot), current rates are in general found to be higher.
The production rate variability implied by the current dataset has an exponential increase,  , that is steeper than what is typical for comets (, Biver et al. 1999). For comparison, the dash-dotted line in Fig. 3 represents a production rate variation
  , with a value QHCN(1 au) = 1.08 × 1026 s-1 chosen to fit the first of the Paganini et al. (2014) data points. This trend fits the Biver et al. (2014) data rather well. On the other hand, based on their near-infrared data, Paganini et al. (2014) report an even steeper increase in the water production rate of
  s-1, and an HCN abundance of around 0.3% with respect to water. The dashed line in Fig. 3 represents such a production rate variation for HCN with QHCN(1 au) = 0.003 × 6.66 × 1028 = 2.00 × 1026 s-1. We note that all production rates reported from later dates, including those of the present study, fall below this predicted trend. In fact, when assigning equal weight to all of the data points included in Fig. 3, the power law that best reproduces the HCN production rate variability of R1 Lovejoy is
  s-1 (dotted line in Fig. 3); this production rate variability is very similar to that derived from the current dataset alone.
Thus, even though the derived HCN production rates vary by factors of a few over timescales of days, the trend these production rates represent follows the general variation of the comet. We cannot determine whether the substantial variation is an effect of a rotating, inhomogeneous nucleus, or overall fluctuation in nucleus activity. We cannot discern any periodicity either in the variations presented here or over subsets of data from days with longer integration times. We note that the Paganini data also show substantial variation over days, albeit within a factor of two.
This study implies a global HCN abundance relative to water in R1 Lovejoy of 1.0–2.8× 10⁻³ with a mean of 0.2%, which is somewhat lower than reported by Paganini et al. (2014) (0.3%), but within the range of what is measured for comets in general (0.09–0.5%; Mumma & Charnley 2011).
4.2. Q2 Lovejoy
The HCN production rate of comet Q2 Lovejoy on the single day of observations was higher than what we observe from R1 Lovejoy over three weeks approaching perihelion. More noteworthy is that, compared to the production rates of R1 Lovejoy at similar heliocentric distances of around 1.3 au that were determined by Paganini et al. (2014), Q2 Lovejoy was producing more than five times more HCN; this indicates a significantly higher level of volatile outgassing from the nucleus. Corroborating this, Biver et al. (2015) concluded that Q2 Lovejoy was one of the most active comets in the last two decades, enabling these authors to detect a suite of complex organic molecules in its coma.
Our observations imply a global HCN abundance relative to water of 9 × 10⁻⁴, which Biver et al. (2015) also report as the average over their observing period. This demonstrates the excellent performance of the available receiver system at the OSO20 m for comet observations.
5. Conclusions
We have presented Onsala 20 m observations of HCN J = 1–0 in comets C/2013 R1 (Lovejoy) and C/2014 Q2 (Lovejoy) within a month of their respective perihelion passages. Our estimated HCN production rates for R1 Lovejoy between November 22 and December 15, at 0.7–2.4 × 1026 molecules s-1, are somewhat higher than previously reported for overlapping dates (Biver et al. 2014). However, the implied increase in the production rates with heliocentric distance,  , represents well the overall increase over the time R1 Lovejoy was observed, from Rh = 1.35 (Paganini et al. 2014) and inward. The implied mean HCN abundance relative to water in R1 Lovejoy is 0.2%.
The HCN production rate we estimate for Q2 Lovejoy at a heliocentric distance of 1.3 au, ~4.5 × 1026 molecules s-1, is more than five times higher relative to comet R1 Lovejoy at similar heliocentric distances. The implied mean HCN abundance relative to water, 0.09%, is the same as reported by Biver et al. (2015) for an observing period including the date of our observations.
The comparison in data quality between the presented cometary observations with the OSO20 m demonstrates the high performance of the upgraded 3 mm receiver system and its potential for future coma monitoring of relatively bright comets.
Acknowledgments
We sincerely thank Nicolas Biver for being gracious enough to assist in modelling the non-LTE radiative transfer and whose comments greatly improved the paper. We are also grateful to Stefanie Milam for useful advice on the analysis.
References
- Agúndez, M., Biver, N., Santos-Sanz, P., Bockelée-Morvan, D., & Moreno, R. 2014, A&A, 564, L2 [NASA ADS] [CrossRef] [EDP Sciences] [Google Scholar]
- Belitsky, V., Lapkin, I., Fredrixon, M., et al. 2015, A&A, 580, A29 [NASA ADS] [CrossRef] [EDP Sciences] [Google Scholar]
- Biver, N., Bockelée-Morvan, D., Crovisier, J., et al. 1999, AJ, 118, 1850 [NASA ADS] [CrossRef] [Google Scholar]
- Biver, N., Bockelée-Morvan, D., Crovisier, J., et al. 2000, AJ, 120, 1554 [NASA ADS] [CrossRef] [Google Scholar]
- Biver, N., Crovisier, J., Bockelée-Morvan, D., et al. 2012, A&A, 539, A68 [NASA ADS] [CrossRef] [EDP Sciences] [Google Scholar]
- Biver, N., Bockelée-Morvan, D., Debout, V., et al. 2014, A&A, 566, L5 [Google Scholar]
- Biver, N., Bockelée-Morvan, D., Moreno, R., et al. 2015, Sci. Adv., 1, 1500863 [NASA ADS] [CrossRef] [Google Scholar]
- Bockelee-Morvan, D., & Crovisier, J. 1985, A&A, 151, 90 [NASA ADS] [Google Scholar]
- Bockelée-Morvan, D., Crovisier, J., Mumma, M. J., & Weaver, H. A. 2004, In Comets II (Tucson: University of Arizona Press), 391 [Google Scholar]
- Cordiner, M. A., Remijan, A. J., Boissier, J., et al. 2014, ApJ, 792, L2 [NASA ADS] [CrossRef] [Google Scholar]
- Crovisier, J. 1994, J. Geophys. Res., 99, 3777 [NASA ADS] [CrossRef] [Google Scholar]
- DiSanti, M. A., Bonev, B. P., Villanueva, G. L., & Mumma, M. J. 2013, ApJ, 763, 1 [Google Scholar]
- Lovejoy, T., Guido, E., Howes, N., et al. 2013, Central Bureau Electronic Telegrams, 3649, 1 [Google Scholar]
- Lovejoy, T., Jacques, C., Pimentel, E., & Barros, J. 2014, Central Bureau Electronic Telegrams, 3934, 1 [NASA ADS] [Google Scholar]
- Müller, H. S. P., Schlöder, F., Stutzki, J., & Winnewisser, G. 2005, J. Mol. Struct., 742, 215 [NASA ADS] [CrossRef] [Google Scholar]
- Mumma, M. J., & Charnley, S. B. 2011, ARA&A, 49, 471 [NASA ADS] [CrossRef] [Google Scholar]
- Paganini, L., Mumma, M. J., Villanueva, G. L., et al. 2014, ApJ, 791, 122 [NASA ADS] [CrossRef] [Google Scholar]
- Remijan, A. J., Milam, S. N., Womack, M., et al. 2008, ApJ, 689, 613 [NASA ADS] [CrossRef] [Google Scholar]
- Rodgers, S. D., & Charnley, S. B. 2005, MNRAS, 356, 1542 [NASA ADS] [CrossRef] [Google Scholar]
All Tables
All Figures
|
Fig. 1 HCN total average spectrum for C/2013 R1 (Lovejoy), including data from all detection days. The three hyperfine components are indicated with arrows. |
| In the text | |
|
Fig. 2 Average HCN spectrum for C/2014 Q2 (Lovejoy) on January 14, 2015. The three hyperfine components are indicated with arrows. |
| In the text | |
|
Fig. 3 HCN production rates as a function of heliocentric distance for comet C/2013 R1 Lovejoy. Error bars shown for the current data (crosses) do not include uncertainties in model parameters, but only reflect measurement errors. Circles represent data from Paganini et al. (2014), stars data from Agúndez et al. (2014), and triangles data from Biver et al. (2014). The solid line illustrates the best fit to the current data, |
| In the text | |
Current usage metrics show cumulative count of Article Views (full-text article views including HTML views, PDF and ePub downloads, according to the available data) and Abstracts Views on Vision4Press platform.
Data correspond to usage on the plateform after 2015. The current usage metrics is available 48-96 hours after online publication and is updated daily on week days.
Initial download of the metrics may take a while.