Free Access
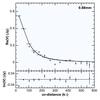
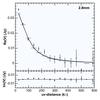
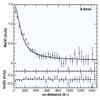
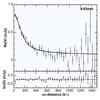
Fig. C.1

AS 209 bin-averaged visibilities as a function of deprojected baseline length (uv-distance). Black dots represent the observed data, the colored area represents the density of models for each uv-distance bin, and the lines are defined as in Fig. 5.
This figure is made of several images, please see below:
Current usage metrics show cumulative count of Article Views (full-text article views including HTML views, PDF and ePub downloads, according to the available data) and Abstracts Views on Vision4Press platform.
Data correspond to usage on the plateform after 2015. The current usage metrics is available 48-96 hours after online publication and is updated daily on week days.
Initial download of the metrics may take a while.