Fig. 6
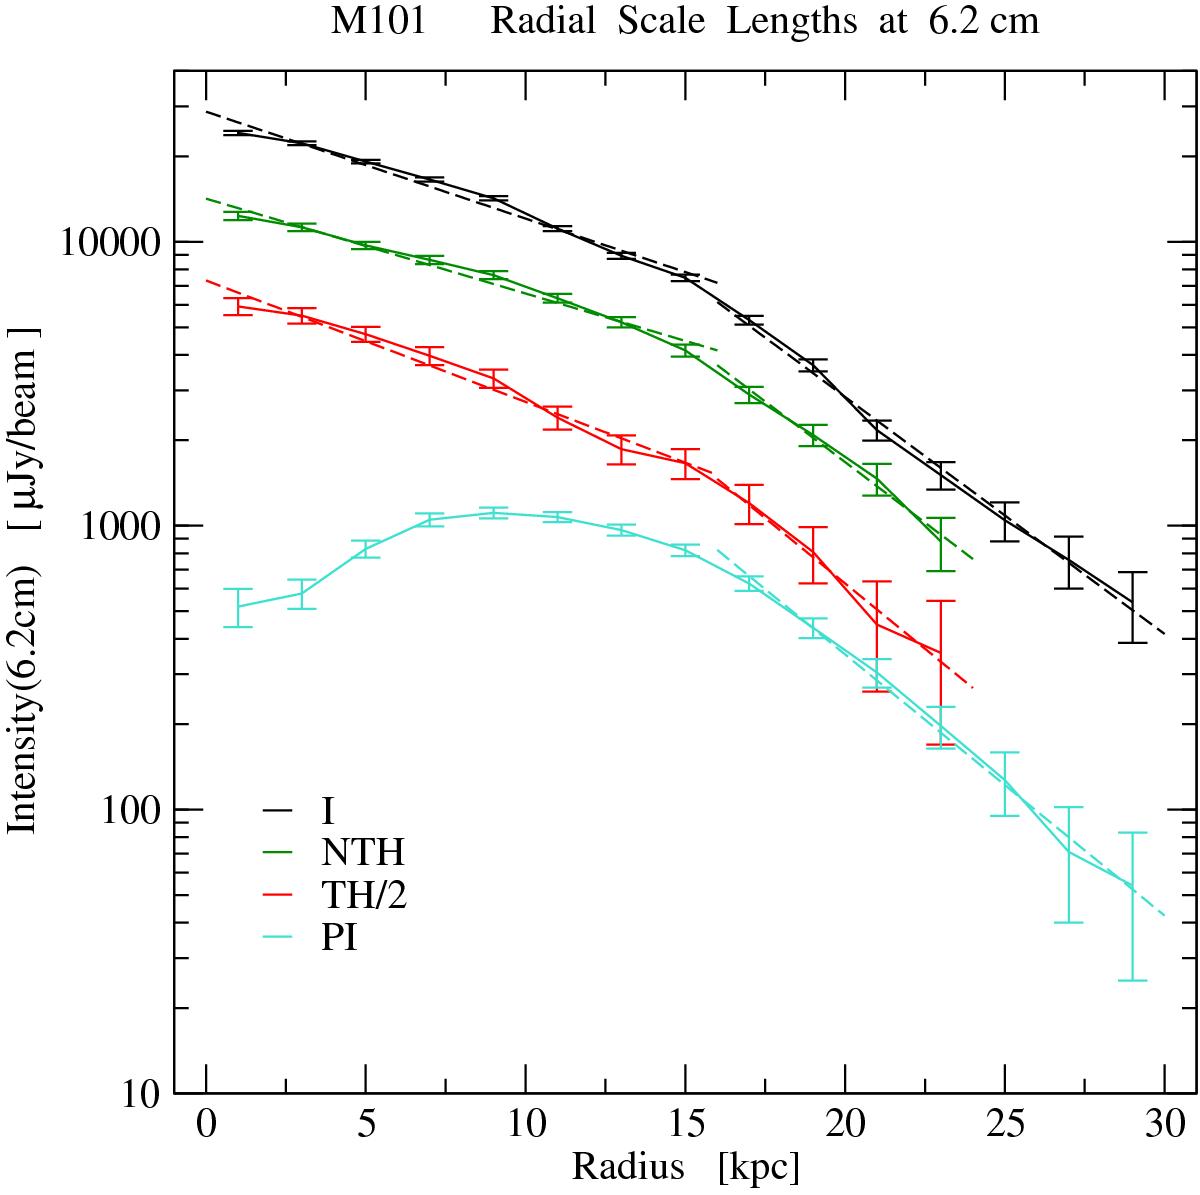
Average intensity in 2 kpc-wide rings in the plane of M 101 of I and the emission components NTH, TH and PI plotted against galacto-centric radius. For clarity, intensities of TH are halved. Errors are standard deviations. Note the change in the slopes near R=16 kpc. Dashed lines show the fits giving the exponential radial scale lengths listed in Table 4.
Current usage metrics show cumulative count of Article Views (full-text article views including HTML views, PDF and ePub downloads, according to the available data) and Abstracts Views on Vision4Press platform.
Data correspond to usage on the plateform after 2015. The current usage metrics is available 48-96 hours after online publication and is updated daily on week days.
Initial download of the metrics may take a while.