Fig. 4
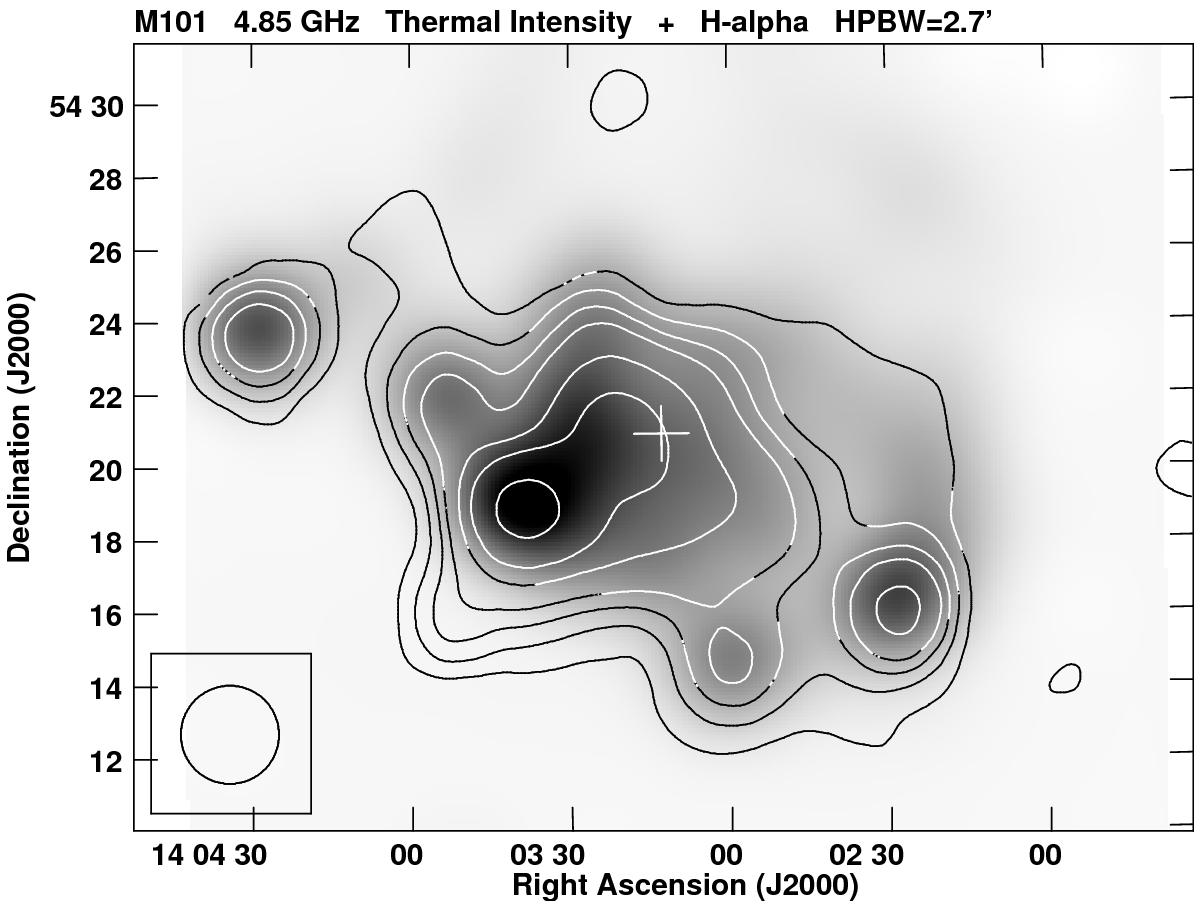
Distribution of the thermal radio emission from M 101 at λ 6.2 cm overlaid on a greyscale plot of the Hα emission of Hoopes et al. (2001) smoothed to the same beamwidth of ![]() (shown in the lower left corner). Contour levels are (1, 2, 3, 4, 6, 8, and 12) × 1.5 mJy/beam area . The noise level is about 0.5 mJy/beam area . The white plus shows the position of the optical centre. The strong source near the eastern border of the map is the H ii -region complex NGC 5471.
(shown in the lower left corner). Contour levels are (1, 2, 3, 4, 6, 8, and 12) × 1.5 mJy/beam area . The noise level is about 0.5 mJy/beam area . The white plus shows the position of the optical centre. The strong source near the eastern border of the map is the H ii -region complex NGC 5471.
Current usage metrics show cumulative count of Article Views (full-text article views including HTML views, PDF and ePub downloads, according to the available data) and Abstracts Views on Vision4Press platform.
Data correspond to usage on the plateform after 2015. The current usage metrics is available 48-96 hours after online publication and is updated daily on week days.
Initial download of the metrics may take a while.