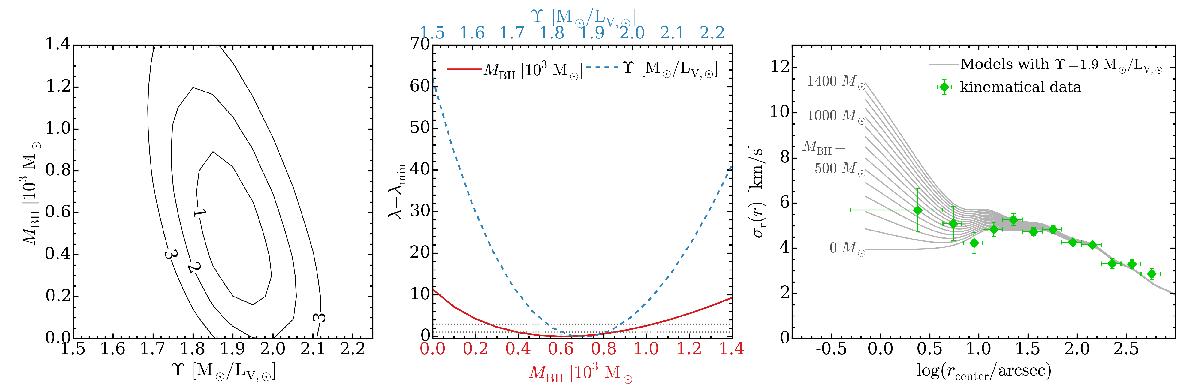
Fig. 8
Comparison between the kinematical data and the predictions of spherical Jeans models with a constant mass-to-light ratio Υ and different masses MBH for a central black hole. The left panel shows the distribution of likelihoods in the Υ-MBH plane. Solid lines give 1, 2, and 3σ confidence intervals. The marginalised distributions of both Υ and MBH are shown in the central panel. The dotted lines indicate the 1 and 3σ confidence intervals. The right panel compares the velocity dispersion predicted by models with a mass-to-light ratio of Υ = 1.9 M⊙/L⊙ and different black hole masses to the kinematical data.
Current usage metrics show cumulative count of Article Views (full-text article views including HTML views, PDF and ePub downloads, according to the available data) and Abstracts Views on Vision4Press platform.
Data correspond to usage on the plateform after 2015. The current usage metrics is available 48-96 hours after online publication and is updated daily on week days.
Initial download of the metrics may take a while.