Fig. 7
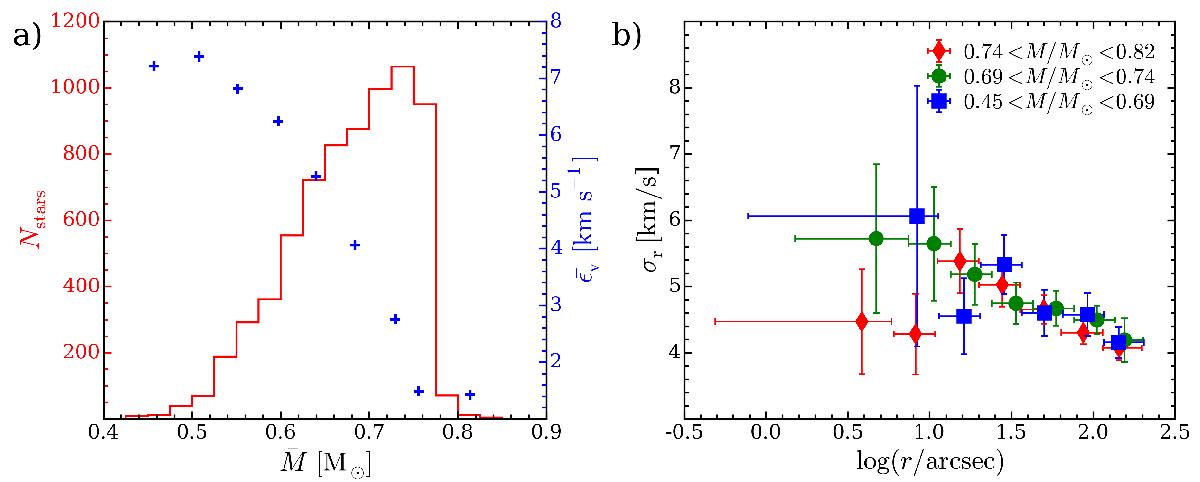
Analysis of the mass-dependent kinematics of NGC 6397. a) The red histogram shows the distribution of stellar masses in the MUSE sample. The median measurement uncertainties of the stellar velocities as a function of mass are shown as blue crosses. b) The velocity dispersion profile as a function of stellar mass. The mass range of each bin is shown in the legend. In contrast to a), only stars with a measurement uncertainty < 5 km s-1 were included in this comparison.
Current usage metrics show cumulative count of Article Views (full-text article views including HTML views, PDF and ePub downloads, according to the available data) and Abstracts Views on Vision4Press platform.
Data correspond to usage on the plateform after 2015. The current usage metrics is available 48-96 hours after online publication and is updated daily on week days.
Initial download of the metrics may take a while.