Fig. 4
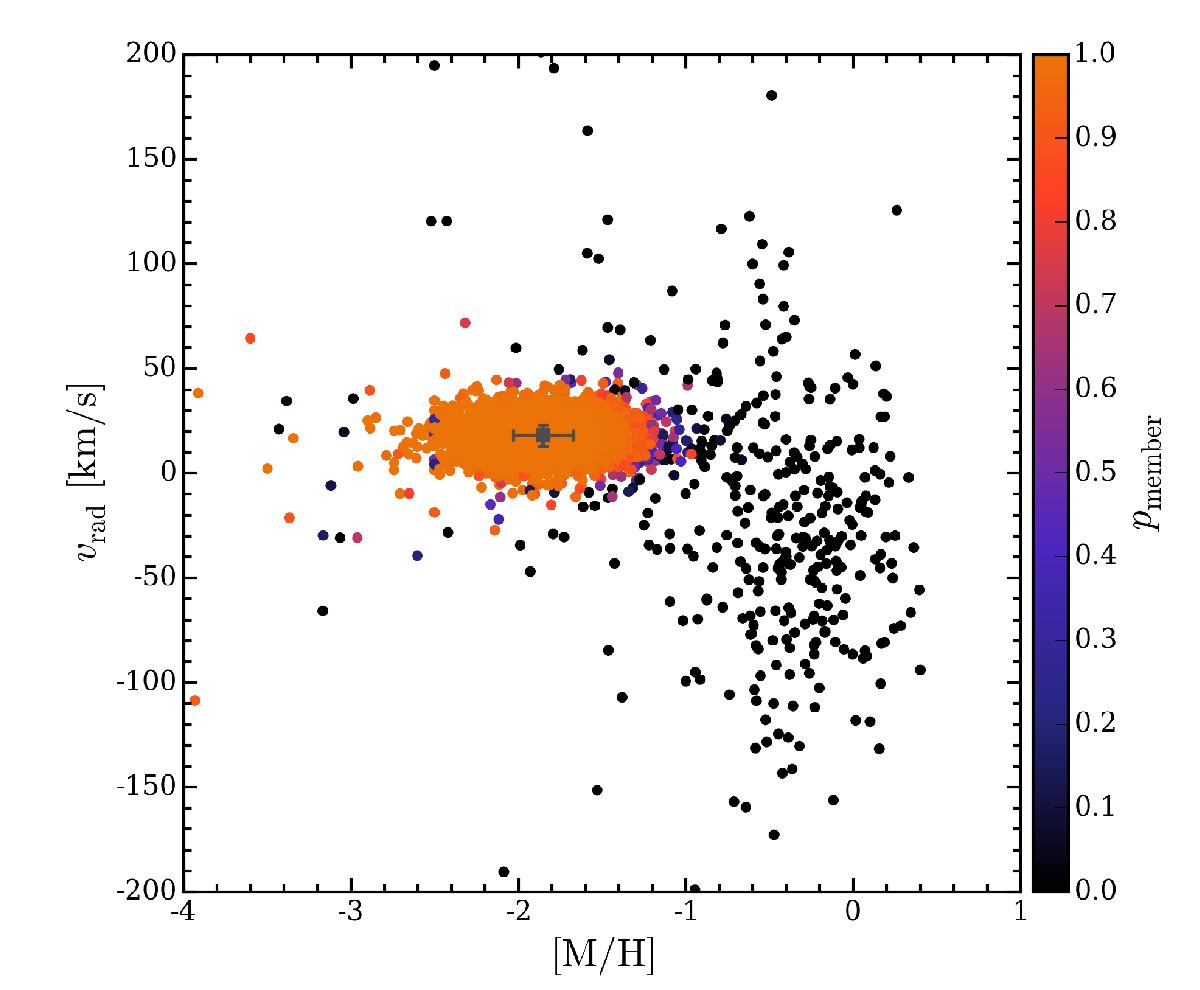
Distribution of all stars in the MUSE sample in the radial velocity vs. metallicity plane, colour-coded using their membership probabilities. Membership probabilities were determined using the EM technique as described in the text. For the cluster population, the mean radial velocity and metallicity plus their intrinsic dispersions are indicated with the grey square. The bulk of orange coloured member stars does not hide any non-member stars.
Current usage metrics show cumulative count of Article Views (full-text article views including HTML views, PDF and ePub downloads, according to the available data) and Abstracts Views on Vision4Press platform.
Data correspond to usage on the plateform after 2015. The current usage metrics is available 48-96 hours after online publication and is updated daily on week days.
Initial download of the metrics may take a while.