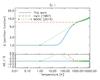
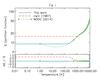
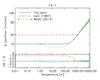
Fig. 4
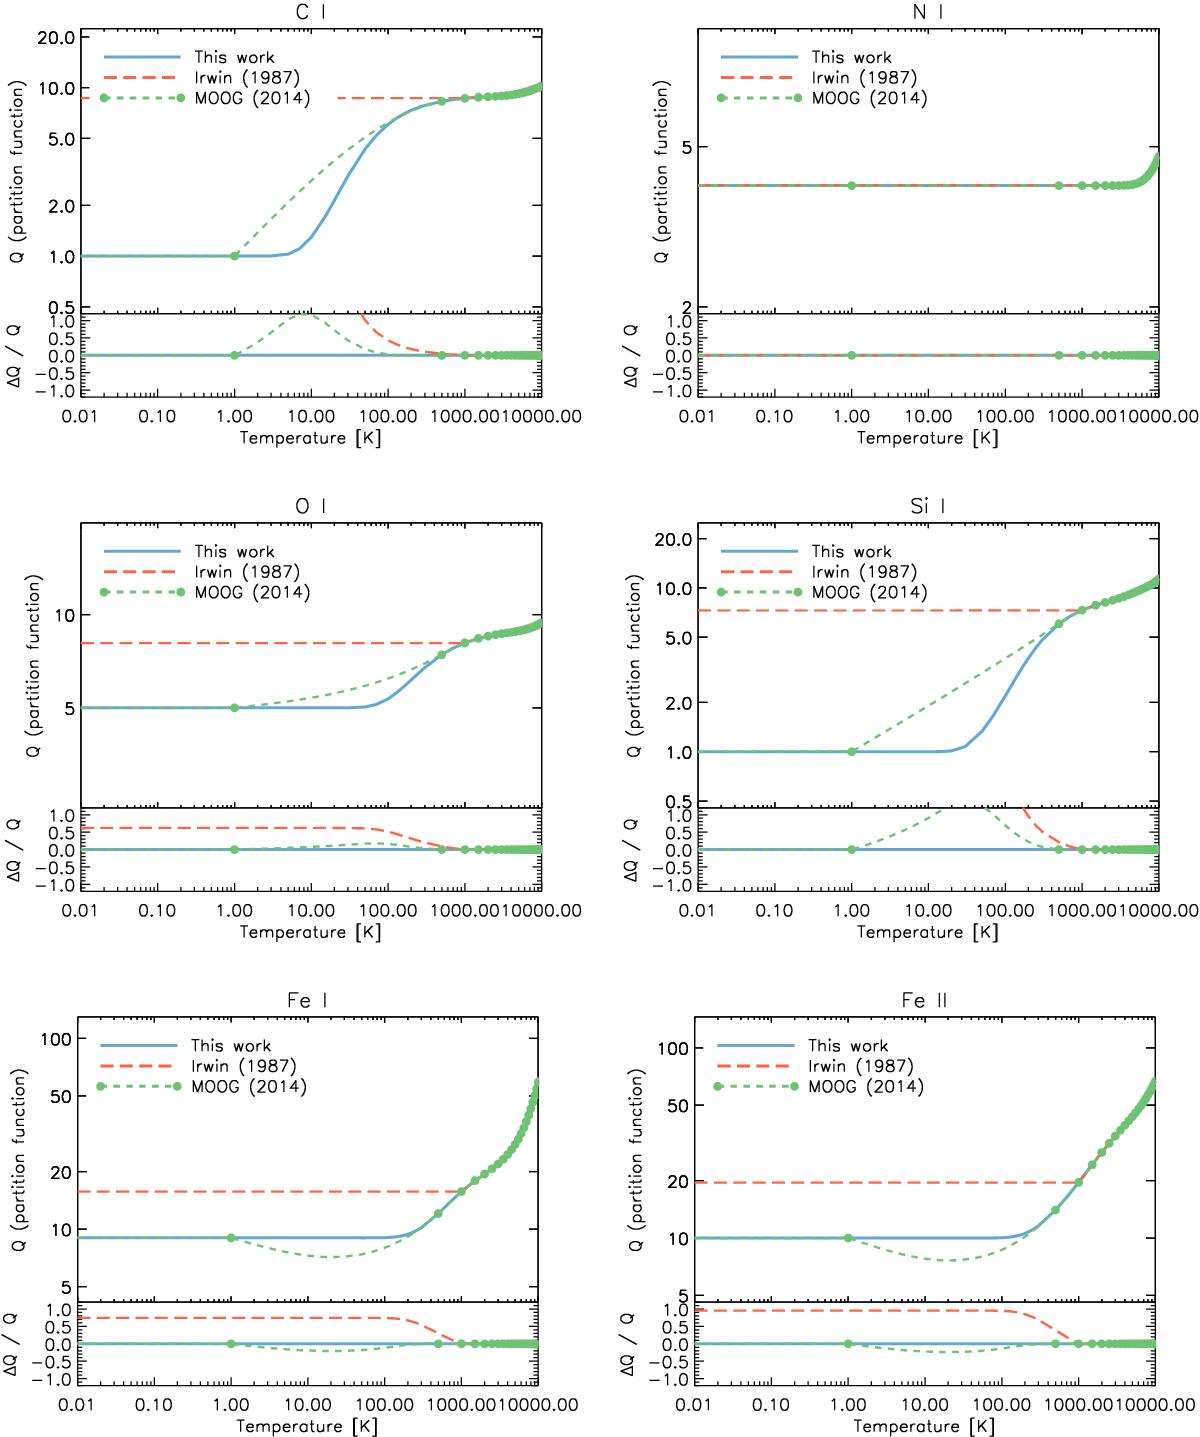
Upper panels: comparison between the atomic partition functions (Q) calculated in this work with data from NIST (blue curves) and the ones provided by Irwin (1987; red curves) and by Lawler & Sneden (MOOG data, version from July 2014; see also Sneden 1973 and updates; green dots). Partition functions from Irwin (1987) are extended to temperatures below 1000 K using constant extrapolation (red dashed curves). Data from Lawler & Sneden are interpolated in between the sampled temperature points using cubic splines in log Q. Lower panels: relative differences between the partition function calculations by the other authors and ours.
Current usage metrics show cumulative count of Article Views (full-text article views including HTML views, PDF and ePub downloads, according to the available data) and Abstracts Views on Vision4Press platform.
Data correspond to usage on the plateform after 2015. The current usage metrics is available 48-96 hours after online publication and is updated daily on week days.
Initial download of the metrics may take a while.