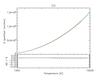
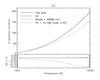
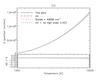
Fig. 3
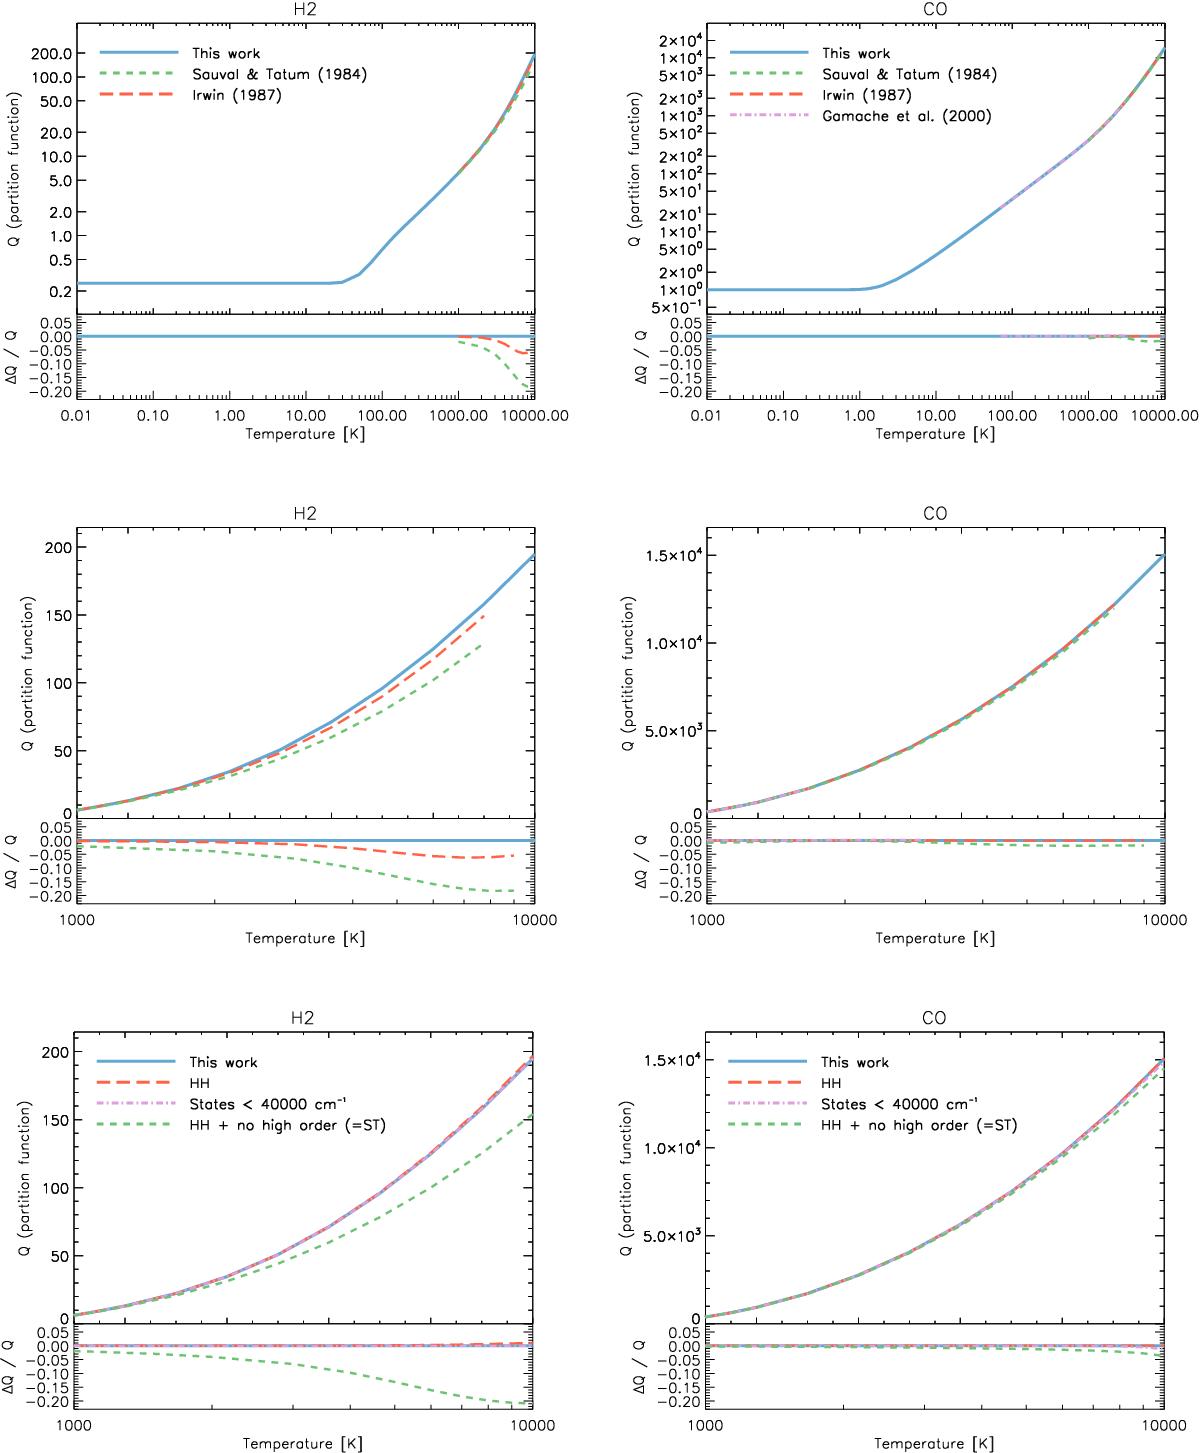
Partition function comparisons for H2 (left column) and CO (right column). Upper row: partition function (Q) calculated in this work (blue curves) shown on a logarithmic scale. Results from polynomial expressions of ST (green dashed curves), Irwin (1987; red long-dashed curves), and Gamache et al. (2000; purple dot-dashed curves) are also shown. Middle row: same results as for the upper panels are shown on a linear scale over the reduced temperature range 1000 to 10 000 K. Lower row: partition functions calculated in this work under various approximations, allowing the origin of any changes with respect to ST to be identified. Partition functions are recalculated assuming constants from HH, i.e., changes and additions to molecular data are ignored (red long-dashed curves), limiting states to those with Te< 40 000 cm-1, as was done in ST, and thus showing the contribution of high-lying states (purple dot-dashed curves), and with both of these approximations (neglecting high-lying states and using only data from HH), and in addition neglecting higher-order spectroscopic constants that were not considered by ST (green dashed curves). This final calculation should correspond to that of ST (which it does to reasonable precision by comparison with the middle panel), and allows the effect of the higher-order constants to be seen. In each case, the lower panels show relative differences between the plotted results and ours.
Current usage metrics show cumulative count of Article Views (full-text article views including HTML views, PDF and ePub downloads, according to the available data) and Abstracts Views on Vision4Press platform.
Data correspond to usage on the plateform after 2015. The current usage metrics is available 48-96 hours after online publication and is updated daily on week days.
Initial download of the metrics may take a while.