Fig. 10
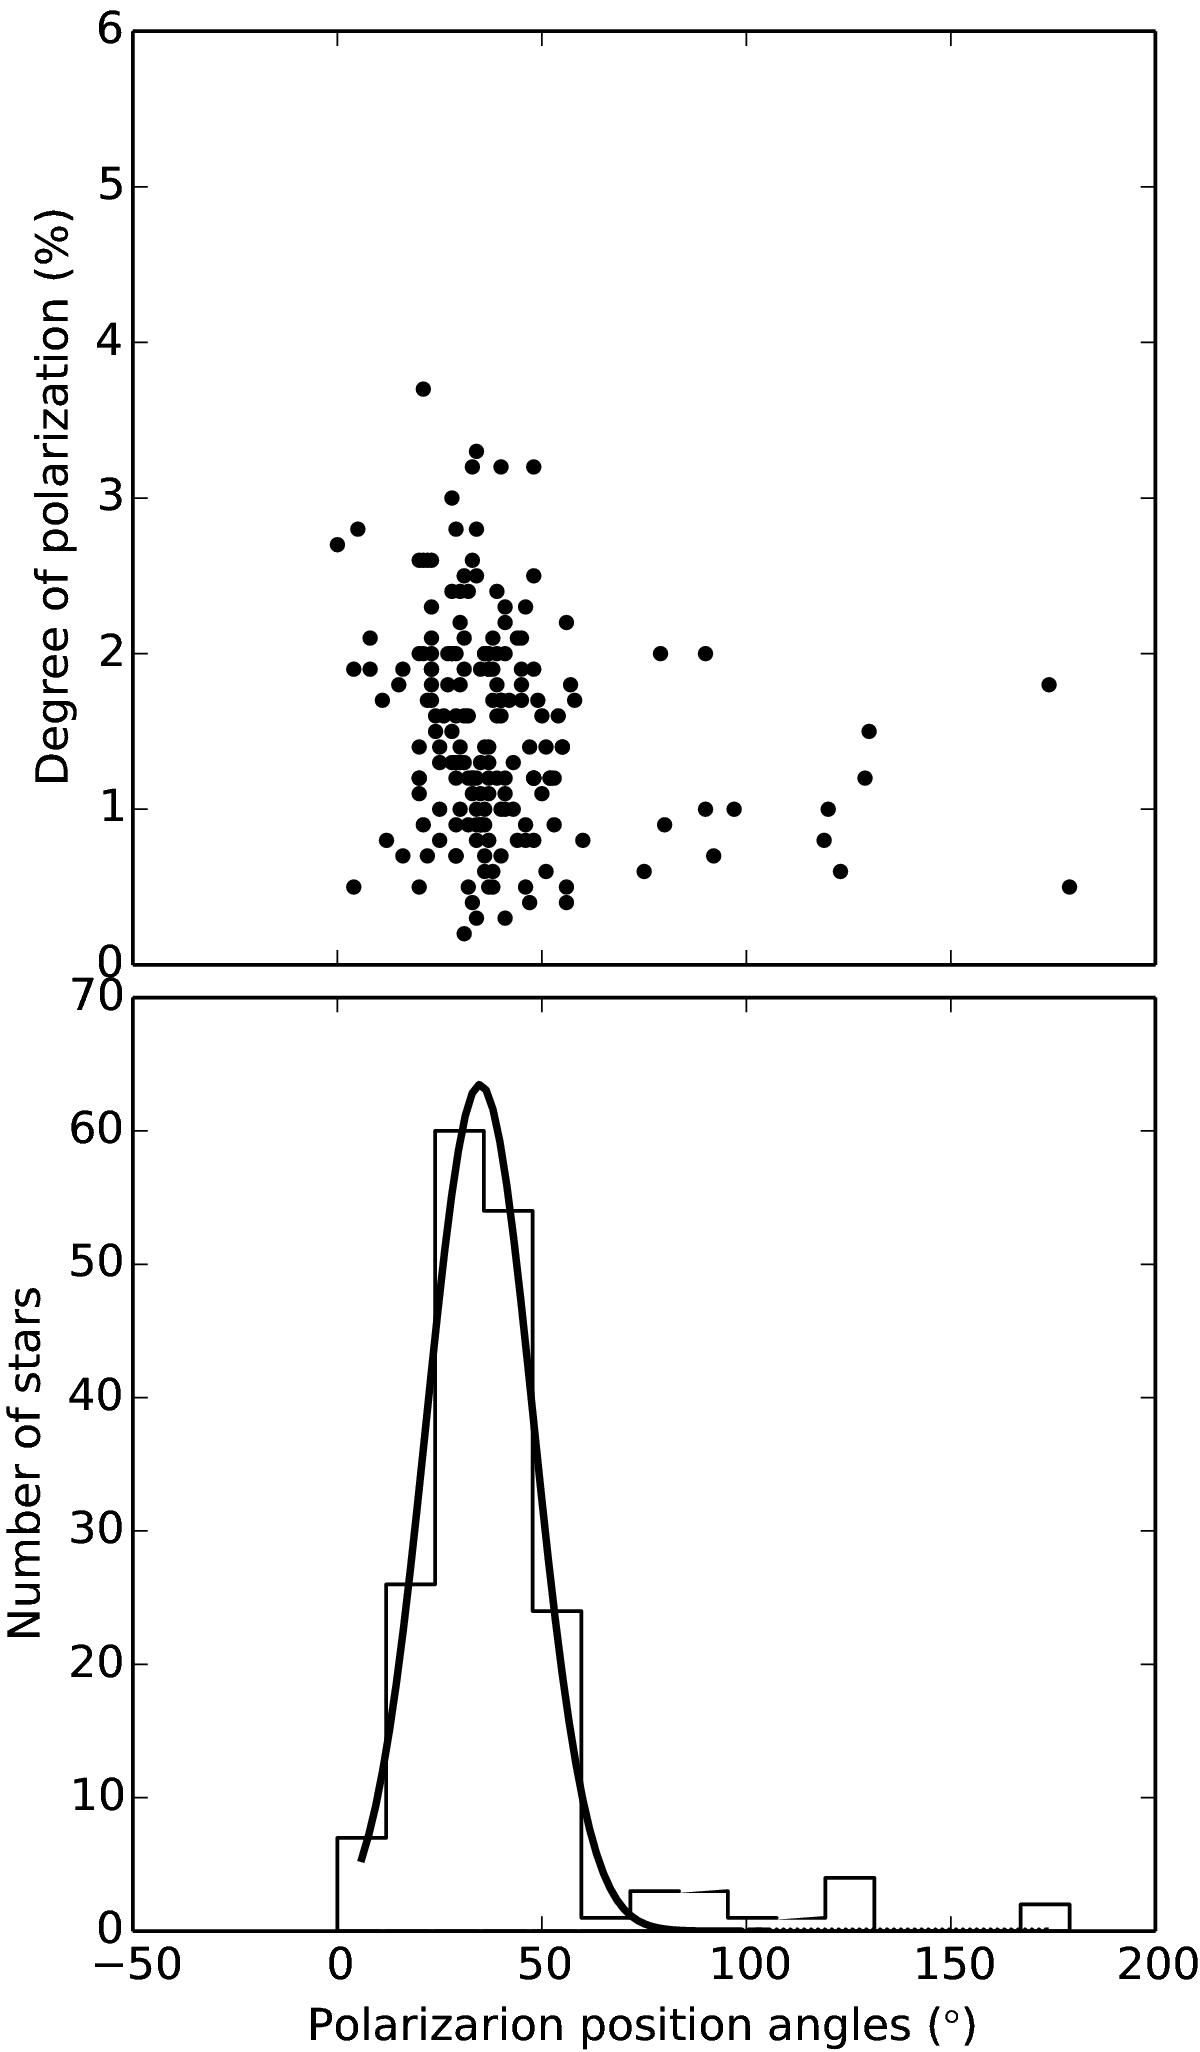
Degree of polarization versus the polarization position angle of stars projected on Gal 110-13. The histogram of the position angles is also presented. These values are obtained after subtracting the foreground interstellar component from the observed values. The solid curve represents a fit to the histogram of position angles.
Current usage metrics show cumulative count of Article Views (full-text article views including HTML views, PDF and ePub downloads, according to the available data) and Abstracts Views on Vision4Press platform.
Data correspond to usage on the plateform after 2015. The current usage metrics is available 48-96 hours after online publication and is updated daily on week days.
Initial download of the metrics may take a while.