Fig. 4
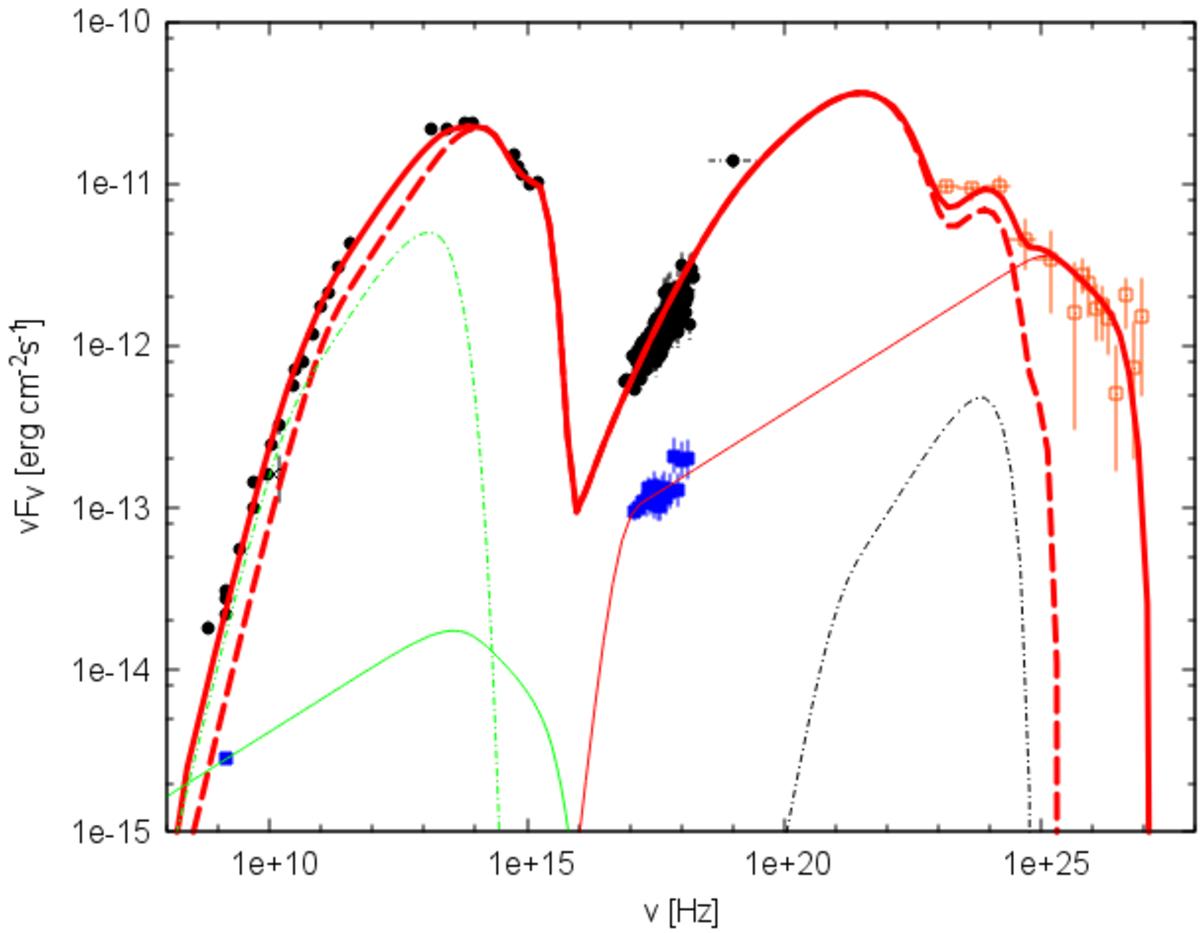
Model including the extended components. Data points are as in Fig. 1. The lines correspond to the total emission of the blob in Fig. 3 (thick, dashed red), synchrotron of the pc-jet (dash-dotted green), IC/DT of the pc-jet (dash-dotted black), synchrotron of the extended jet (solid green), IC/CMB of the extended jet (solid red), and the sum of all components (thick, solid red).
Current usage metrics show cumulative count of Article Views (full-text article views including HTML views, PDF and ePub downloads, according to the available data) and Abstracts Views on Vision4Press platform.
Data correspond to usage on the plateform after 2015. The current usage metrics is available 48-96 hours after online publication and is updated daily on week days.
Initial download of the metrics may take a while.