Fig. 1
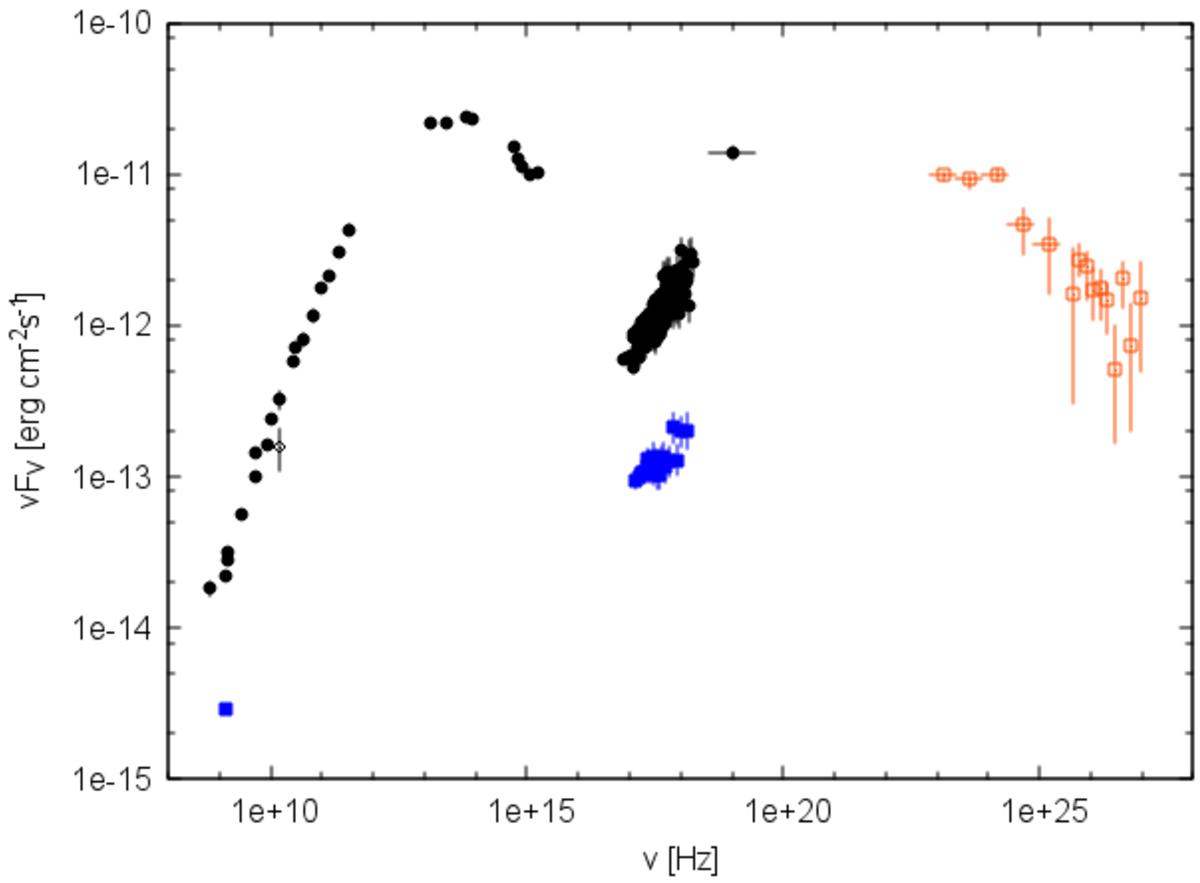
SED of AP Librae. Data attributed to the core on arcsec scales is shown as black dots. Blue squares correspond to the extended jet data. The open diamond at 15 GHz is the flux from component 0 of the MOJAVE observations. The orange open squares are the γ-ray data from Fermi-LAT and the HESS experiment where no discrimination between core and jet is possible.
Current usage metrics show cumulative count of Article Views (full-text article views including HTML views, PDF and ePub downloads, according to the available data) and Abstracts Views on Vision4Press platform.
Data correspond to usage on the plateform after 2015. The current usage metrics is available 48-96 hours after online publication and is updated daily on week days.
Initial download of the metrics may take a while.