Fig. 9
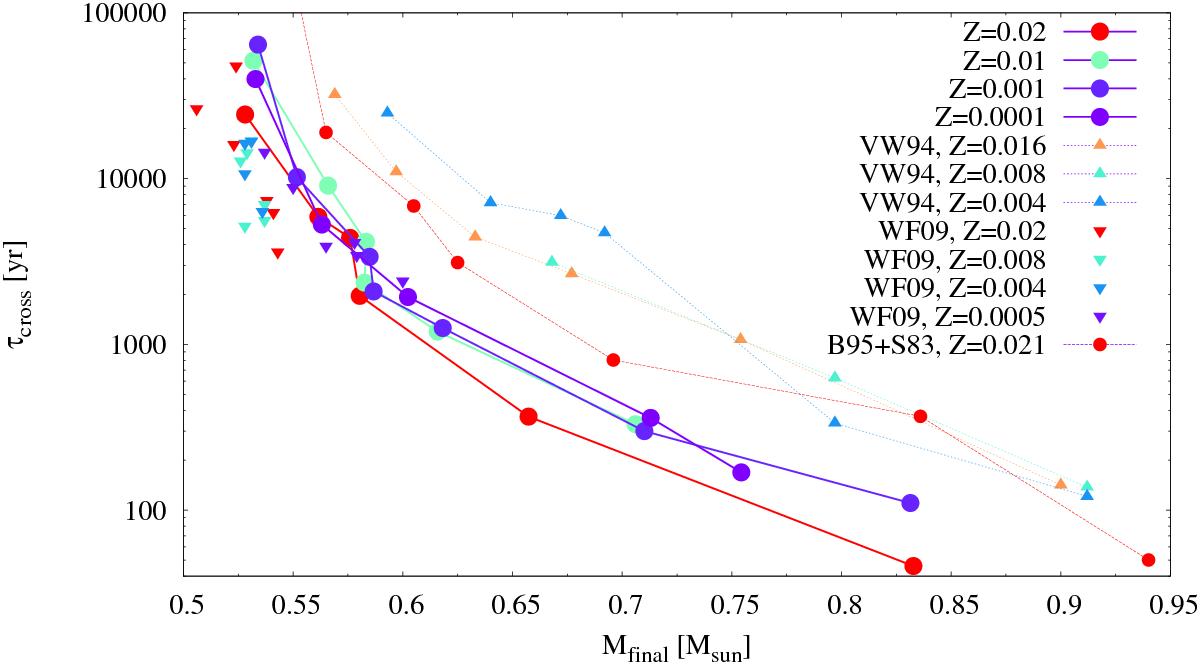
Crossing timescales from the zero point, set at log Teff = 4 to allow comparisons with all previous works, to the point of maximum effective temperature in the HR diagram; i.e., the so-called knee of the evolutionary tracks shown in Fig. 8. Timescales are shown for all the sequences presented and the H-burning post-AGB sequences available in the literature, i.e., (Vassiliadis & Wood 1994, VW94); (Schönberner 1983, Blöcker 1995a, B95+S83); and (Weiss & Ferguson 2009, WF09). Crossing timescales of the new sequences (this work and also Weiss & Ferguson 2009) are much shorter than the crossing timescales of the H-burning models of Schönberner (1983), Vassiliadis & Wood (1994), Blöcker (1995a). The sudden decrease in τcross at Mf ~ 0.58 M⊙ (Z0 = 0.02, 0.01 and 0.001) can be traced back to differences in the previous evolutionary history of the models (see text). Because of slightly different definitions of the zero point, the numbers do not completely agree with the value of τcross given in Table 3.
Current usage metrics show cumulative count of Article Views (full-text article views including HTML views, PDF and ePub downloads, according to the available data) and Abstracts Views on Vision4Press platform.
Data correspond to usage on the plateform after 2015. The current usage metrics is available 48-96 hours after online publication and is updated daily on week days.
Initial download of the metrics may take a while.