Free Access
Fig. 7
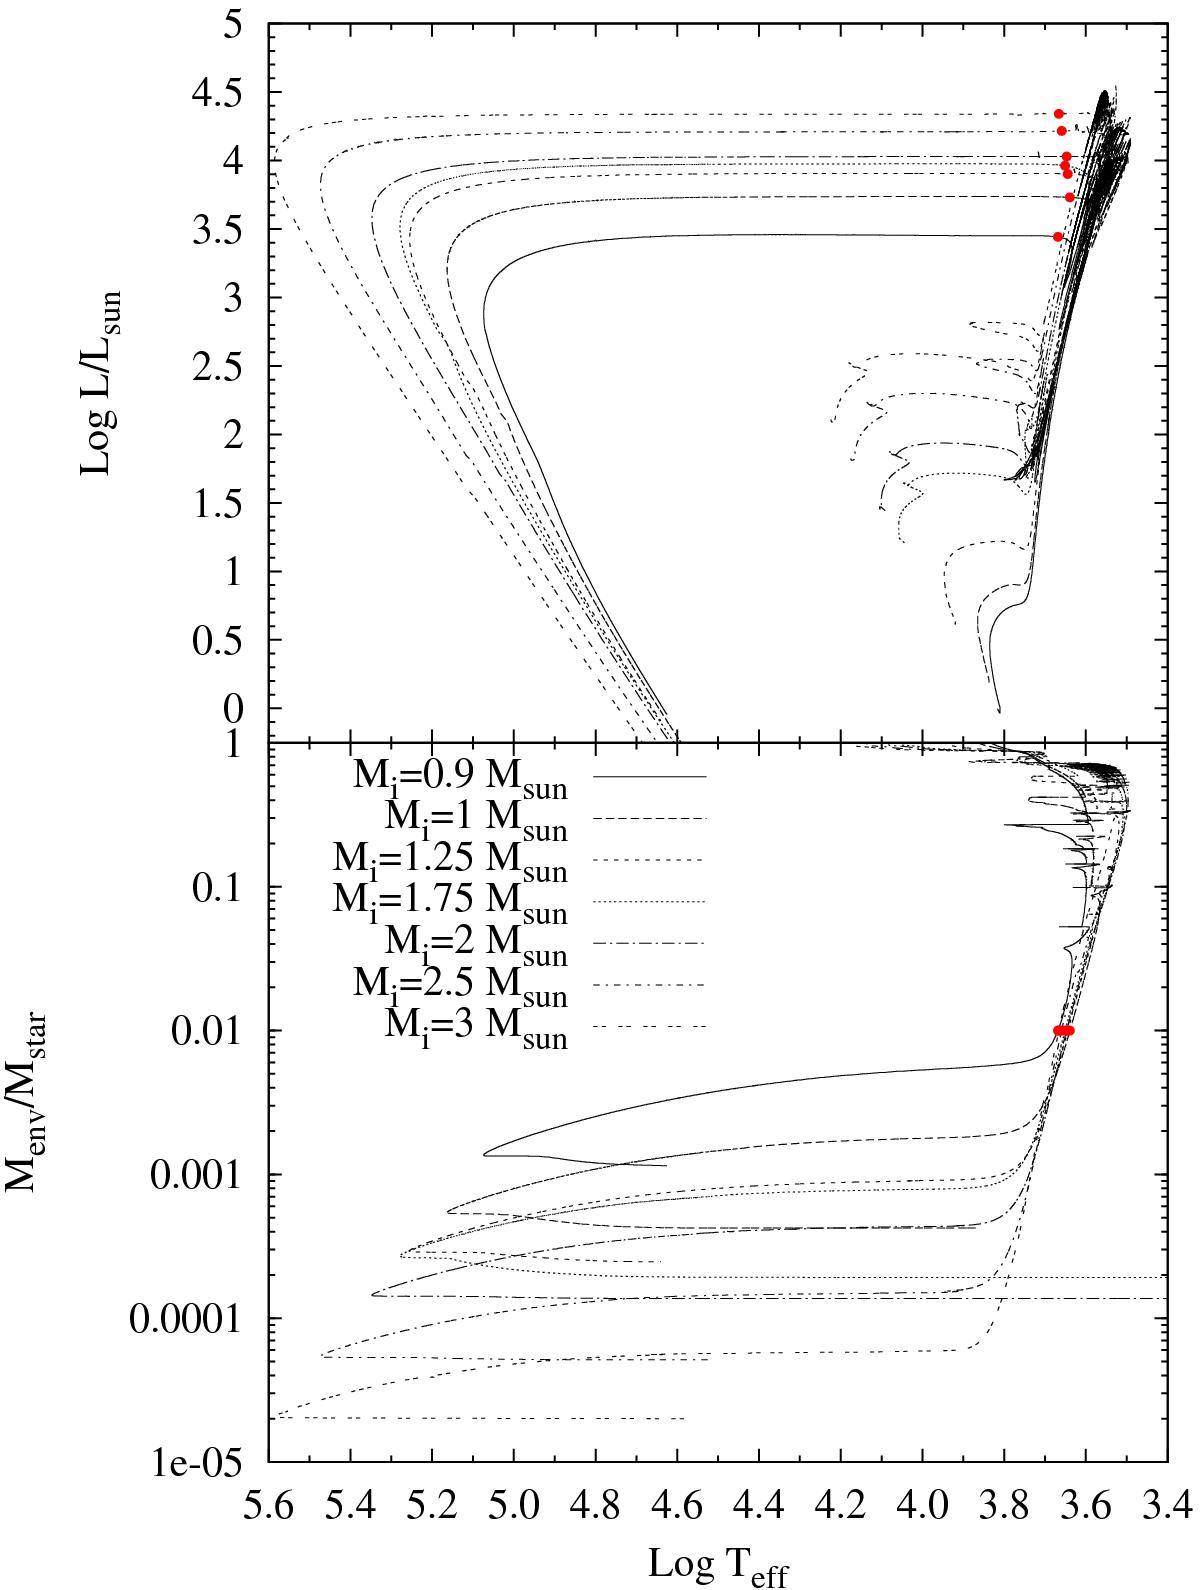
Upper panel: HR diagram of our Z0 = 0.001 sequences that departed from the AGB as H-burners. Lower panel: mass of the H-rich envelope as a function of log Teff for the same sequences. Red dots indicate the moment in which Menv/Mstar = 0.01, which has been used to define the beginning of the post-AGB.
Current usage metrics show cumulative count of Article Views (full-text article views including HTML views, PDF and ePub downloads, according to the available data) and Abstracts Views on Vision4Press platform.
Data correspond to usage on the plateform after 2015. The current usage metrics is available 48-96 hours after online publication and is updated daily on week days.
Initial download of the metrics may take a while.