Fig. 10
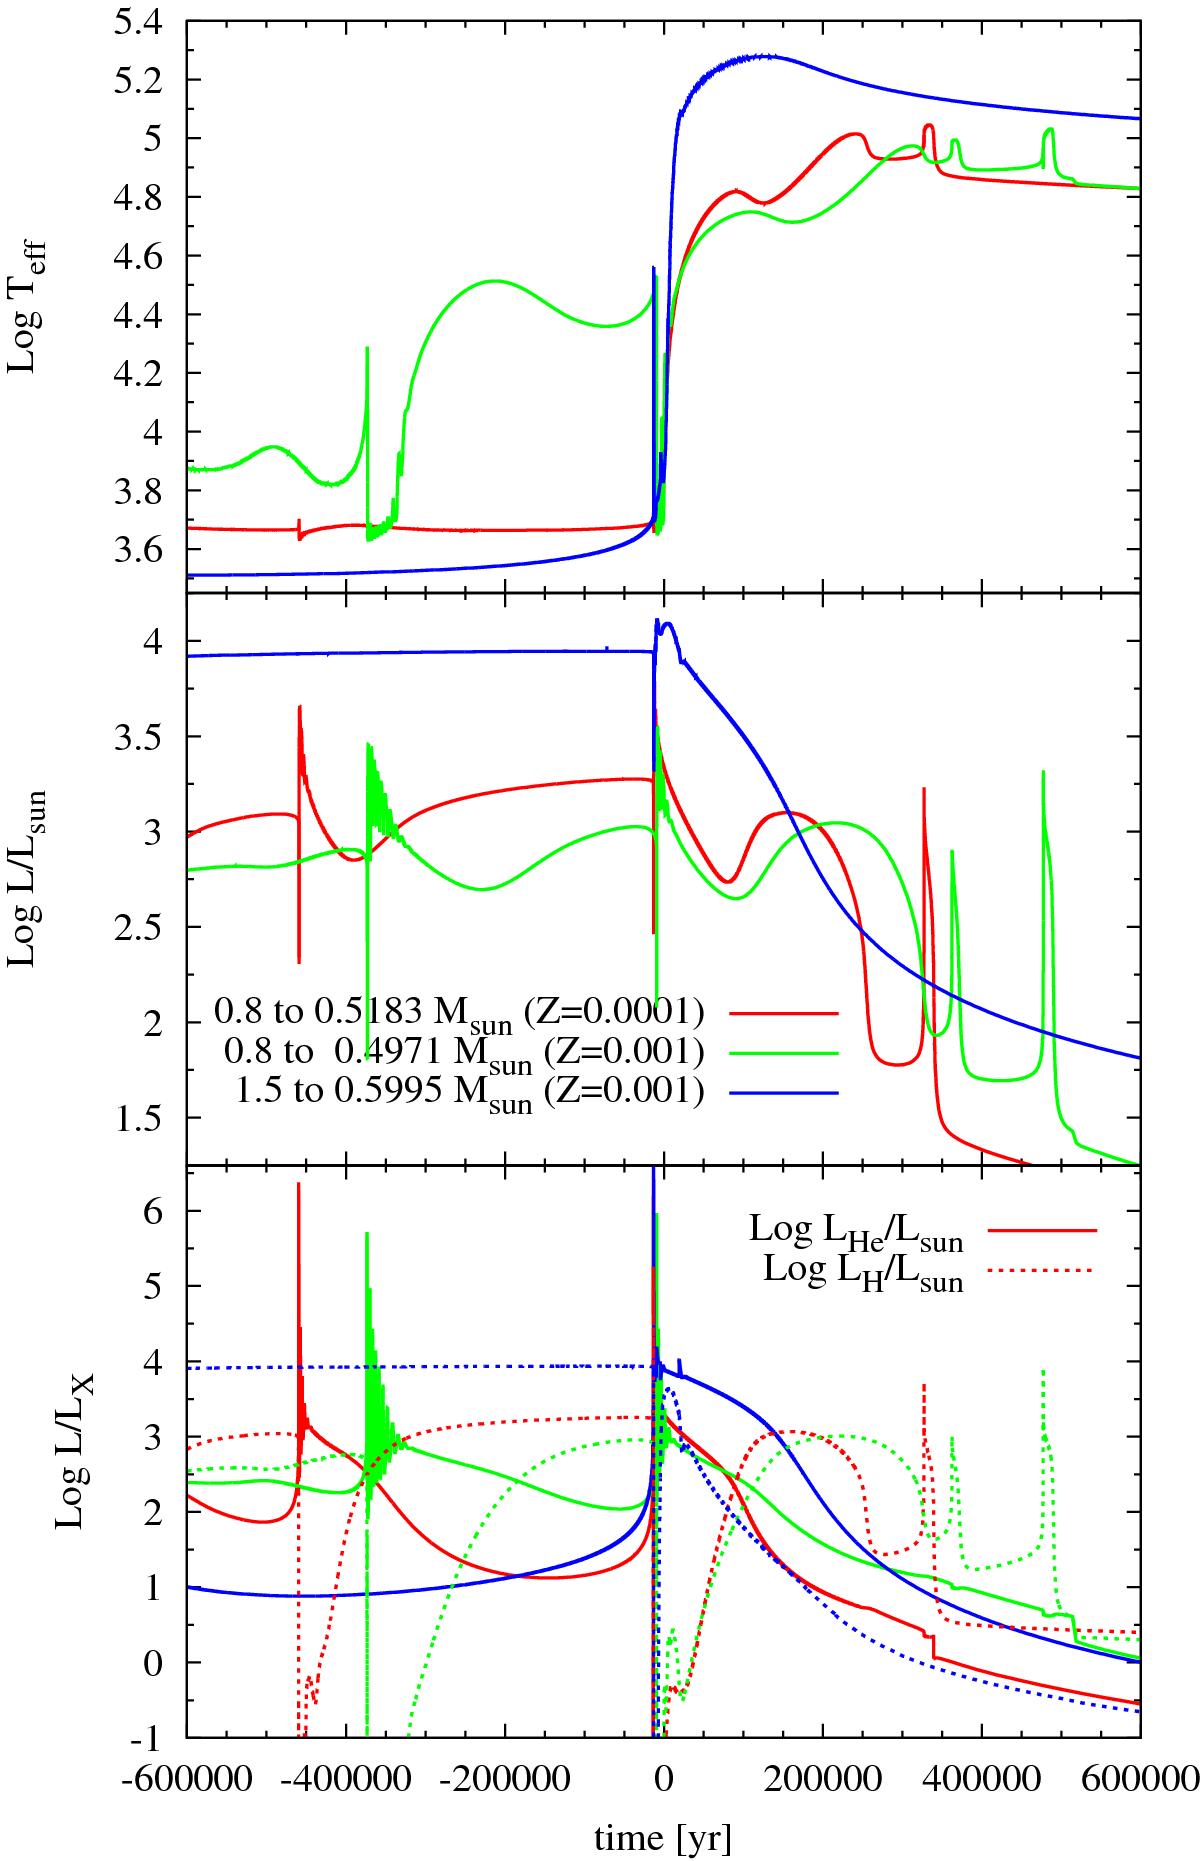
Evolution of log Teff (upper panel) and log L/L⊙ (lower panel) during the post-AGB phase and the end of the TP-AGB. The zero point of the x-axis was taken at the last time the sequence had log Teff = 3.85 before evolving toward the white dwarf cooling phase. Time is shown in years for the Mi = 0.8 M⊙ sequences, but it has been multiplied by a factor 10 for the Mi = 1.5 M⊙ sequence to allow proper visualization.
Current usage metrics show cumulative count of Article Views (full-text article views including HTML views, PDF and ePub downloads, according to the available data) and Abstracts Views on Vision4Press platform.
Data correspond to usage on the plateform after 2015. The current usage metrics is available 48-96 hours after online publication and is updated daily on week days.
Initial download of the metrics may take a while.