Fig. 7
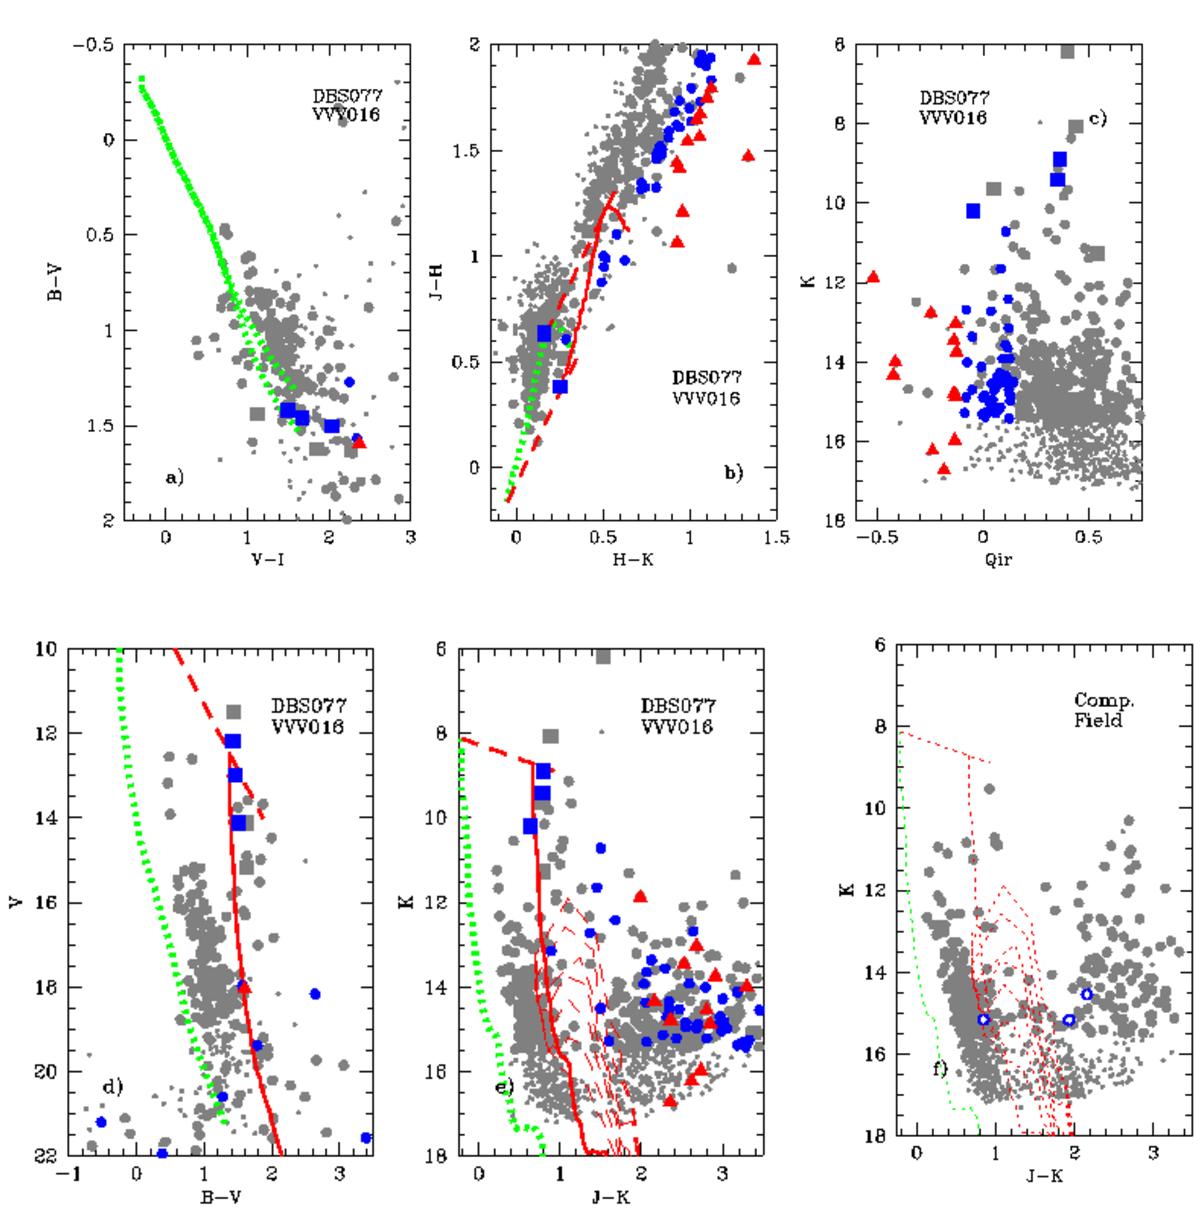
Photometric diagrams for the stars in the DBS 77 + VVV 16 region and their corresponding comparison field (panel f)). Squares and circles represent stars with and without known spectral classification, respectively. Light gray symbols indicate a field population whereas blue and red represent different cluster populations selected by our photometric method (see text in Sect. 3.4). The solid (red) and dotted (green) curves are the ZAMS or MS (see text) shifted according to the distance modulus adopted with and without absorption/reddening, respectively. Dashed (red) lines indicate the normal reddening path (RV = 3.1). Dashed curves are Siess et al. (2000) isochrones for z = 0.02.
Current usage metrics show cumulative count of Article Views (full-text article views including HTML views, PDF and ePub downloads, according to the available data) and Abstracts Views on Vision4Press platform.
Data correspond to usage on the plateform after 2015. The current usage metrics is available 48-96 hours after online publication and is updated daily on week days.
Initial download of the metrics may take a while.