Fig. 6
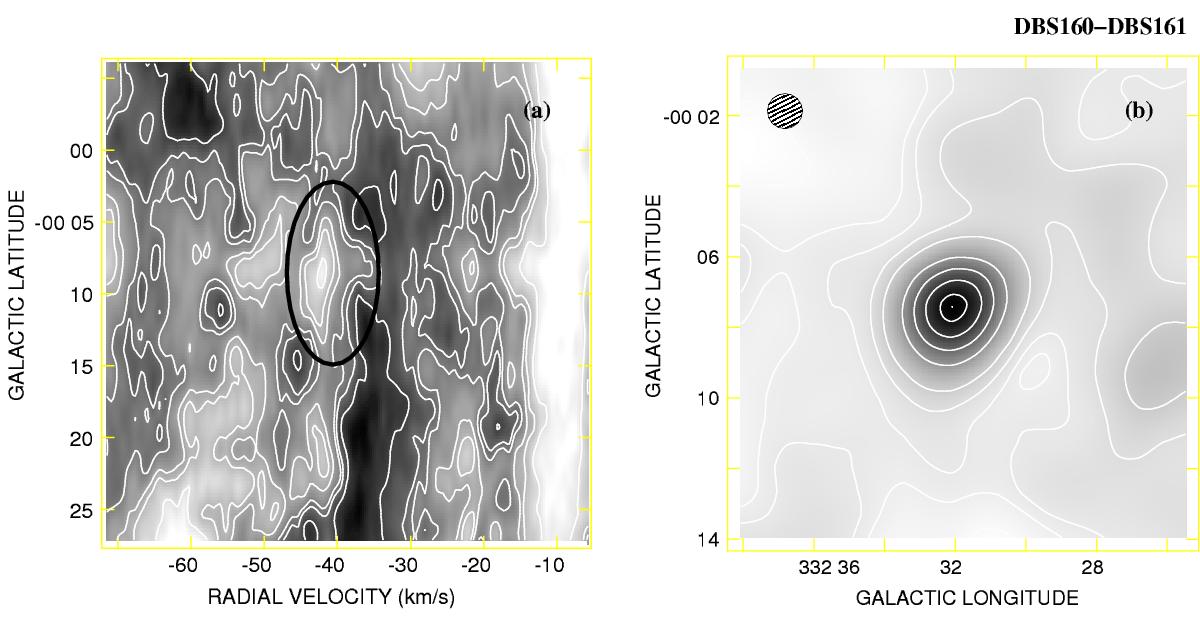
a) Mean Tb HI distribution at DBS 160/161 region between the longitude range from ![]() 52 to
52 to ![]() 55. Contour levels are from 65 K to 105 K in steps of 10 K. The ellipse indicates the interstellar bubble (Fig. 14). HII region (RV ≃ −47 km s-1) is not visible (Bronfman et al. 1996). b) Same as Fig. 5 with the lowest and highest contours indicate 0.04 and 1 Jy beam-1, respectively, without a constant step.
55. Contour levels are from 65 K to 105 K in steps of 10 K. The ellipse indicates the interstellar bubble (Fig. 14). HII region (RV ≃ −47 km s-1) is not visible (Bronfman et al. 1996). b) Same as Fig. 5 with the lowest and highest contours indicate 0.04 and 1 Jy beam-1, respectively, without a constant step.
Current usage metrics show cumulative count of Article Views (full-text article views including HTML views, PDF and ePub downloads, according to the available data) and Abstracts Views on Vision4Press platform.
Data correspond to usage on the plateform after 2015. The current usage metrics is available 48-96 hours after online publication and is updated daily on week days.
Initial download of the metrics may take a while.