Fig. 3
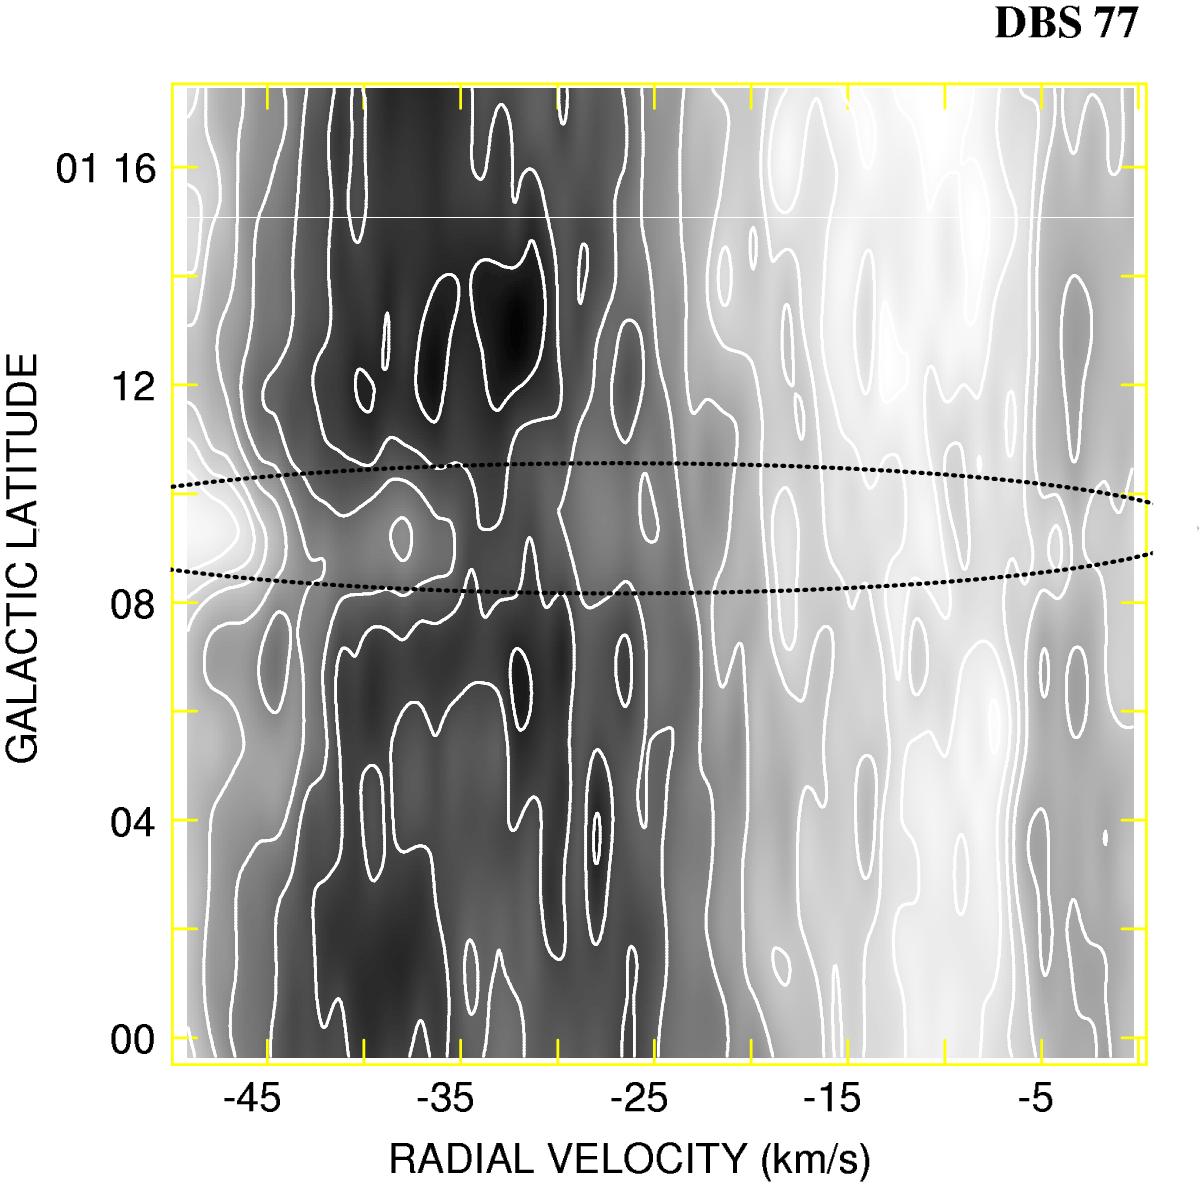
Tb HI distribution at DBS 77 region (l ~ 301°). Black curved lines indicate the place of the HII region (RV = −46 km s-1) and the HI absorption in the line of sight. Lowest and highest contours are 12.4 K and 124 K, respectively. Contour spacing is 6 K until 50 K and 12 K from there onwards. Lighter gray color corresponds to the lowest temperature value.
Current usage metrics show cumulative count of Article Views (full-text article views including HTML views, PDF and ePub downloads, according to the available data) and Abstracts Views on Vision4Press platform.
Data correspond to usage on the plateform after 2015. The current usage metrics is available 48-96 hours after online publication and is updated daily on week days.
Initial download of the metrics may take a while.