Fig. 14
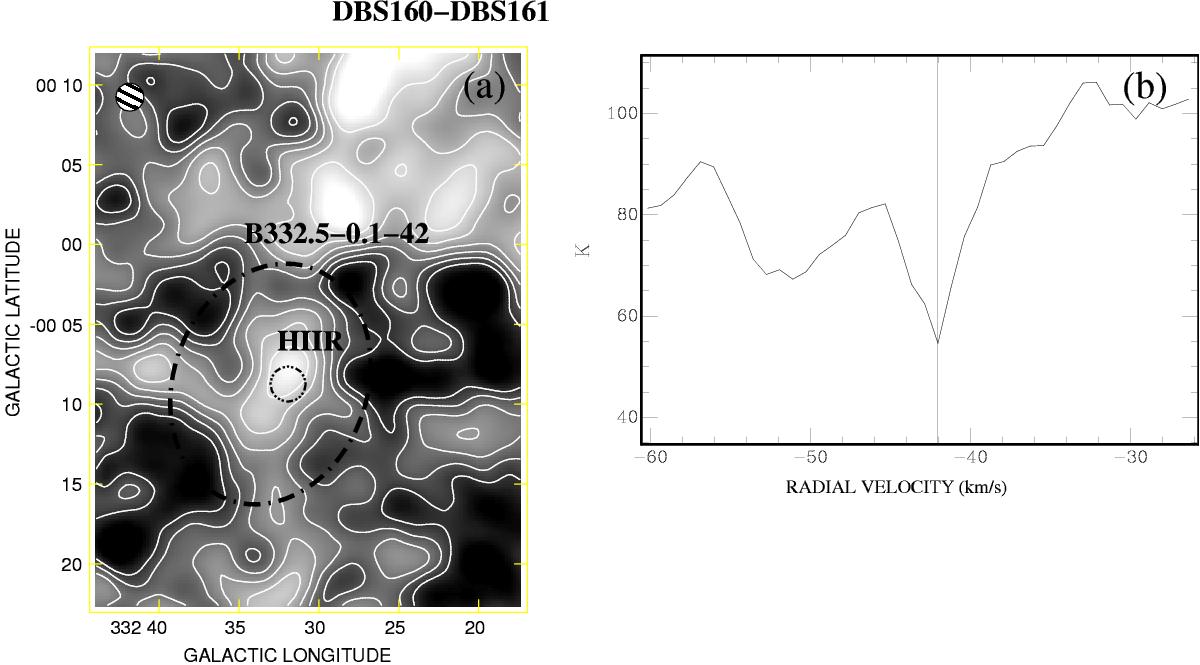
DBS 160−161: a) Mean Tb of the H I emission distribution associated with the B332.5−0.1−42 in the velocity range from −44.5 to −40.4 km s-1. Contour levels are from 80 to 110 K in steps of 5 K. Best-fitted ellipse to the bubble is indicated with dashed lines and the circle inside it indicates the ultra compact HII region GRS332.5−00.10. b) H I brightness temperature profile along ![]() where the vertical line indicates the minimum emission that corresponds to the systemic velocity.
where the vertical line indicates the minimum emission that corresponds to the systemic velocity.
Current usage metrics show cumulative count of Article Views (full-text article views including HTML views, PDF and ePub downloads, according to the available data) and Abstracts Views on Vision4Press platform.
Data correspond to usage on the plateform after 2015. The current usage metrics is available 48-96 hours after online publication and is updated daily on week days.
Initial download of the metrics may take a while.