Fig. 1
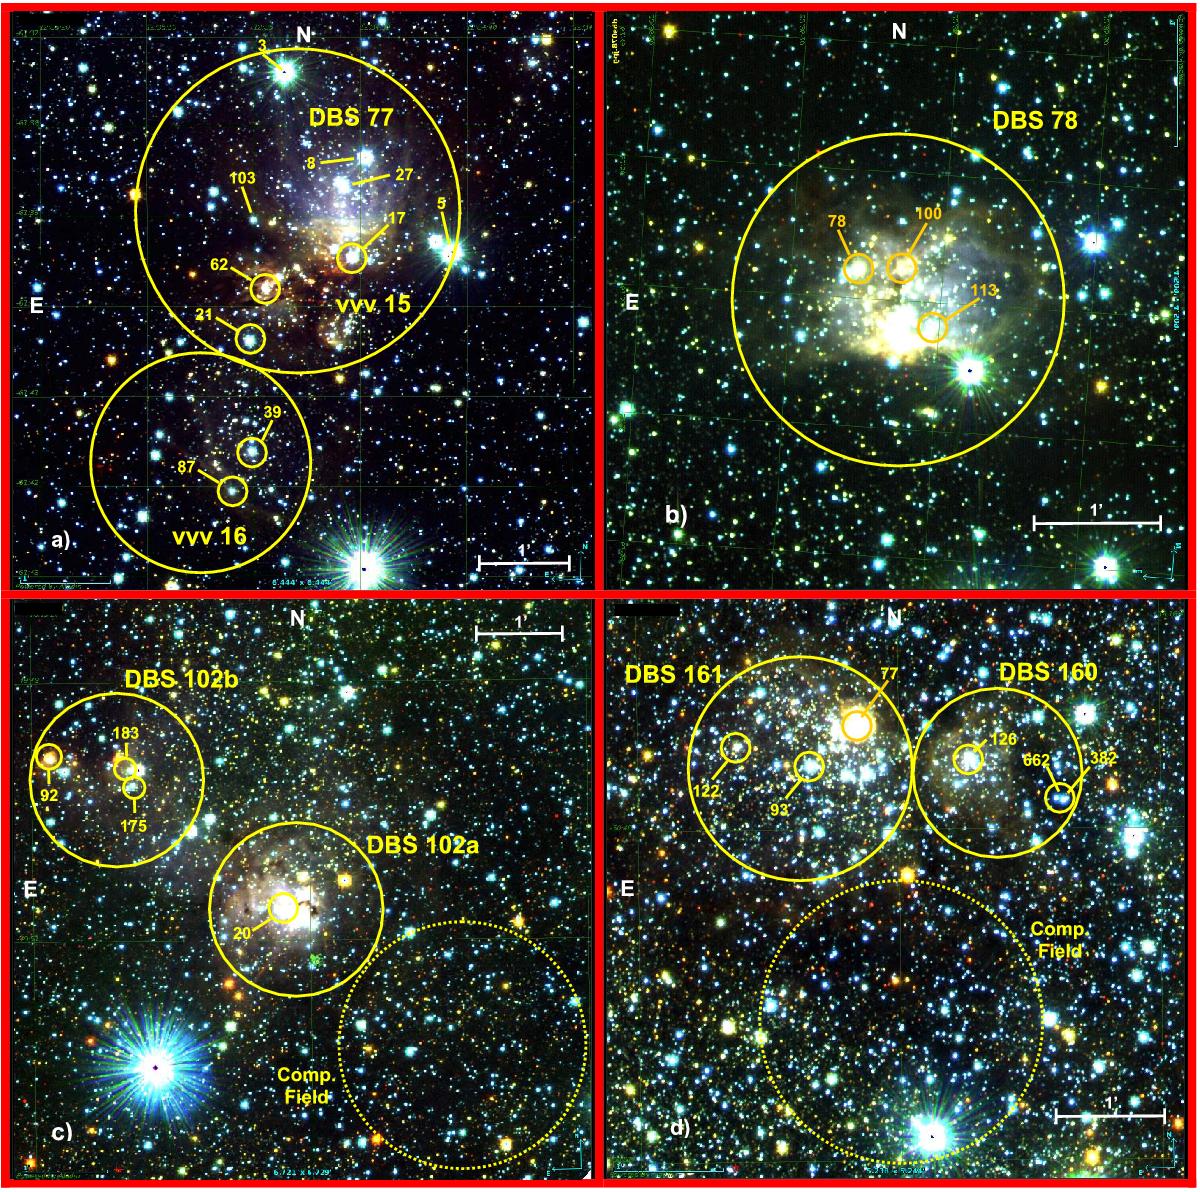
JHK false-color VVV images of the four regions studied. Selected clusters areas are indicated by big solid yellow circles. Comparison fields are also indicated with dotted circles in panels c) and d). Identified stars are those ones with NIR spectroscopy data or adopted brightest cluster members. Stars inside circles are adopted clusters members (see text and Table A.1).
Current usage metrics show cumulative count of Article Views (full-text article views including HTML views, PDF and ePub downloads, according to the available data) and Abstracts Views on Vision4Press platform.
Data correspond to usage on the plateform after 2015. The current usage metrics is available 48-96 hours after online publication and is updated daily on week days.
Initial download of the metrics may take a while.