Fig. 9
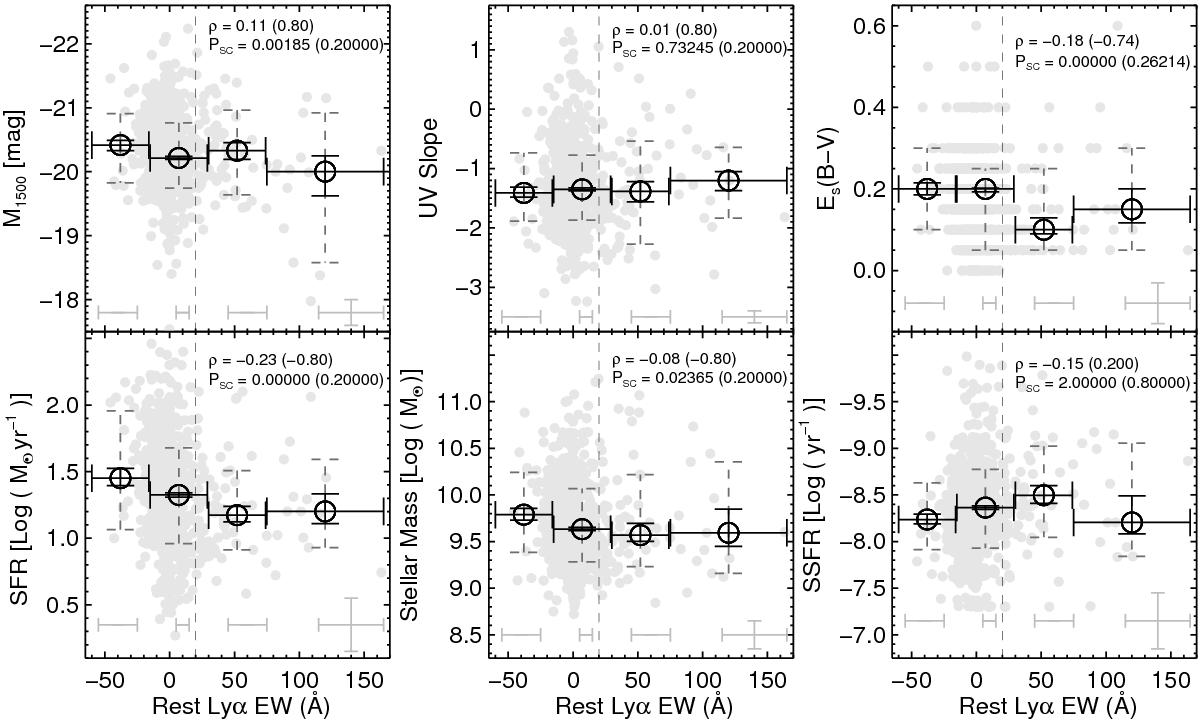
Correlation between rest-frame Lyα EW and best-fit stellar population parameters. The vertical dashed line indicates EW = 20 Å, the adopted lower limit in Lyα equivalent width for LAEs. The size of the last bin is increased with respect to that of the other bins to increase the number of galaxies in that bin. The light gray points are individual measurements while the black circles are binned medians. The error bars in x illustrate the sizes of the bins, while the errors in y are ±1σ scatter (dashed error bars) corresponding to the range between 16th and the 84th percentile values within each bin, while smaller solid error bars are the errors on the median values (![]() ). The statistical significance from the Spearman correlation coefficient for all galaxies (median-binned values) is shown to confirm these correlations. Average uncertainties in these measurements are plotted in the bottom-right corner. The median uncertainties in the EW measurement varies as a function of EW as shown by different x error bars.
). The statistical significance from the Spearman correlation coefficient for all galaxies (median-binned values) is shown to confirm these correlations. Average uncertainties in these measurements are plotted in the bottom-right corner. The median uncertainties in the EW measurement varies as a function of EW as shown by different x error bars.
Current usage metrics show cumulative count of Article Views (full-text article views including HTML views, PDF and ePub downloads, according to the available data) and Abstracts Views on Vision4Press platform.
Data correspond to usage on the plateform after 2015. The current usage metrics is available 48-96 hours after online publication and is updated daily on week days.
Initial download of the metrics may take a while.