Fig. 8
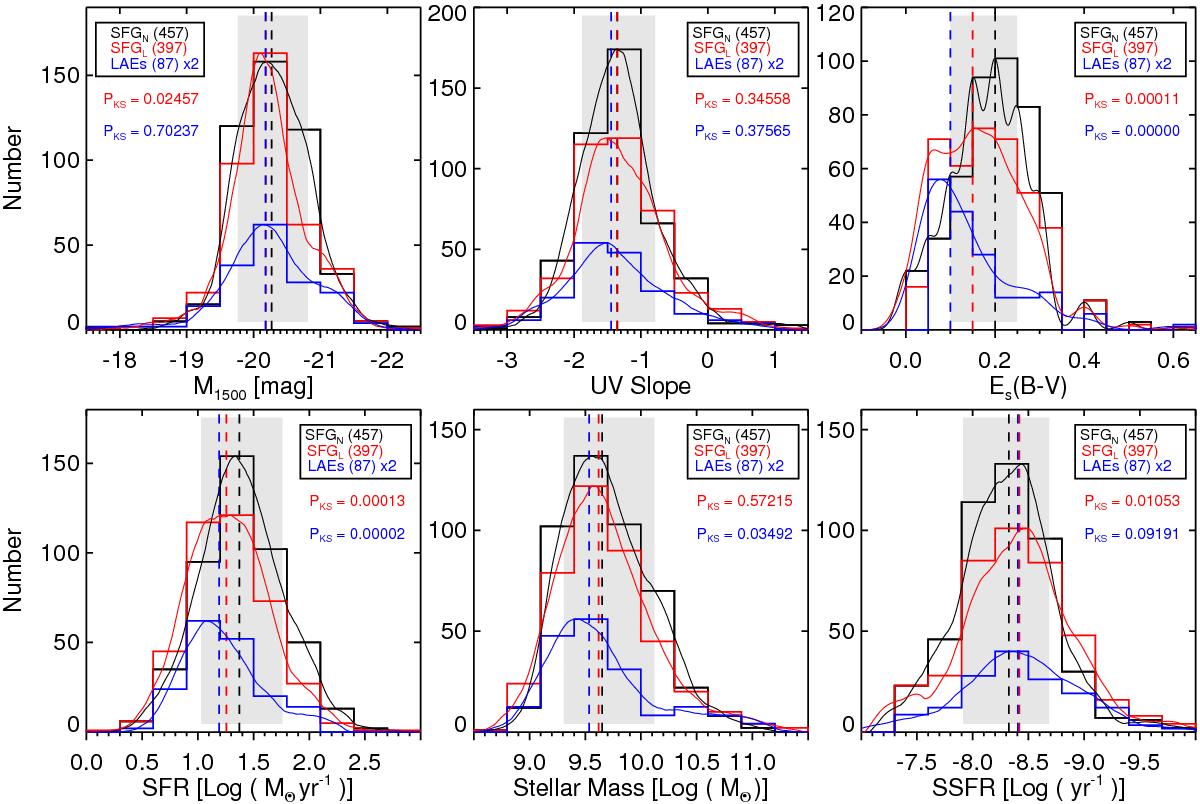
Comparison between SFGN (black histograms), SFGL (red histograms), and LAEs (blue histograms) as a function of stellar parameters. The total number of galaxies identified as SFGN, SFGL, and LAEs are shown in the legend. The median value of the distribution is indicated by a vertical dashed line. The solid curves are KDE of the distribution. The gray shaded regions cover ±1σ dispersion/scatter, which corresponds to the range between the 16th and the 84th percentile values, of the SFGN distribution. The statistical significance based on the KS test (red for SFGL, and blue for LAEs with respect to SFGN) is shown to confirm any correlation.
Current usage metrics show cumulative count of Article Views (full-text article views including HTML views, PDF and ePub downloads, according to the available data) and Abstracts Views on Vision4Press platform.
Data correspond to usage on the plateform after 2015. The current usage metrics is available 48-96 hours after online publication and is updated daily on week days.
Initial download of the metrics may take a while.