Fig. 7
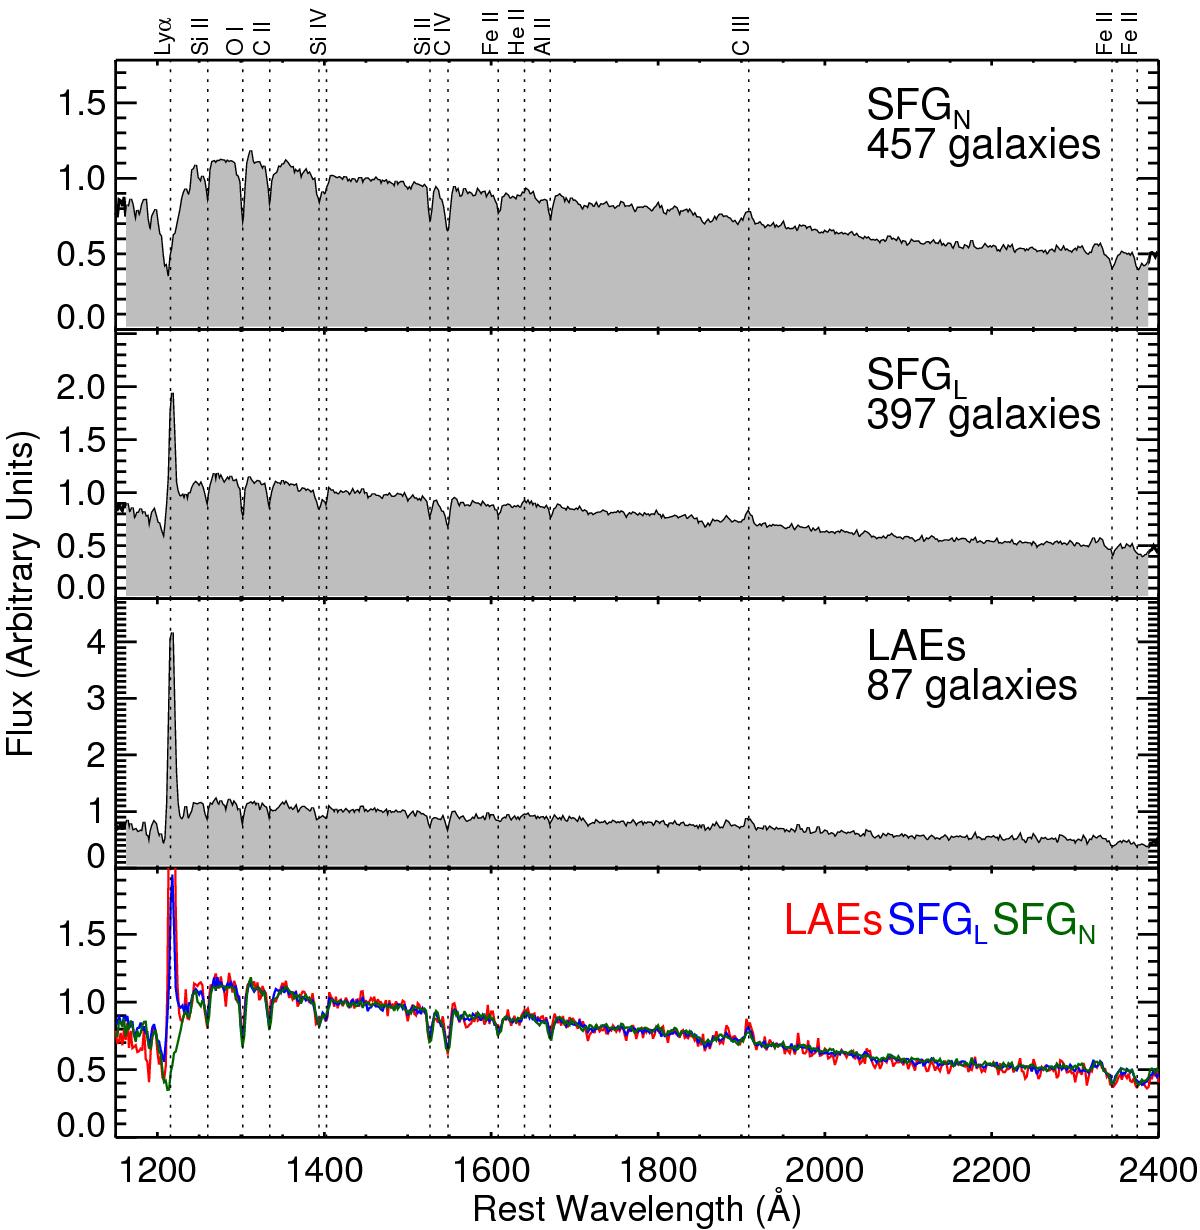
Stacked (median-combined) rest-frame UV spectra for SFGN, SFGL, and LAEs. The strong absorption and emission features are marked by the vertical dotted lines. The SFGN spectrum shows strong absorption lines (Si, C, O, Fe, Al), but these absorption lines get weaker with increasing strength of Lyα-emission. The bottom panel shows similarity in the spectroscopic UV slope for these samples.
Current usage metrics show cumulative count of Article Views (full-text article views including HTML views, PDF and ePub downloads, according to the available data) and Abstracts Views on Vision4Press platform.
Data correspond to usage on the plateform after 2015. The current usage metrics is available 48-96 hours after online publication and is updated daily on week days.
Initial download of the metrics may take a while.