Fig. 6
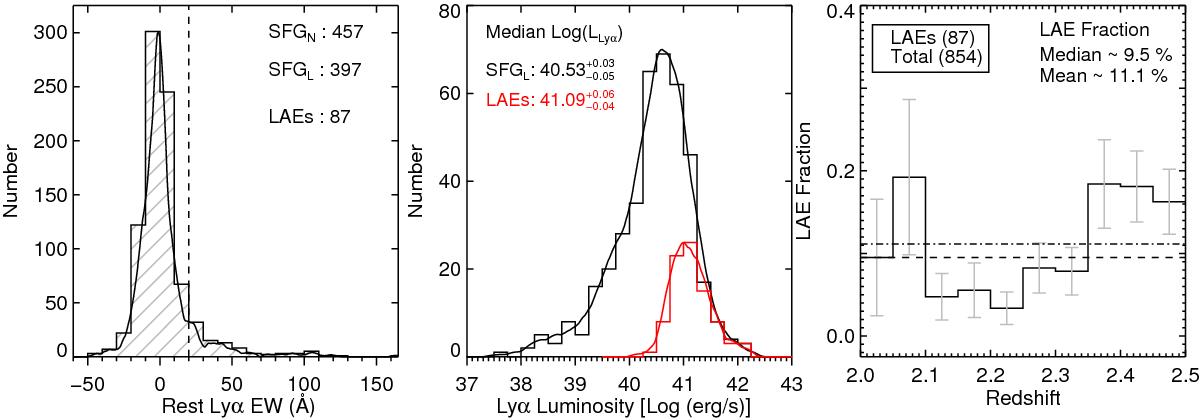
Left: rest-frame EW distribution for SFGs with Lyα in emission (positive EWs) and Lyα in absorption (negative EWs). The vertical dashed line indicates EW = 20 Å, the adopted lower limit in Lyα EW for LAEs (or strong Lyα emitters). The solid curve is the KDE of the distribution. Middle: distribution of Lyα luminosities for the SFGL (black) and the LAE (red) samples. The KDE of the distribution is shown by a solid curve. Right: fraction of LAEs as a function of redshift for our sample. Approximately 10% of SFGs at these redshifts are strong Lyα emitters, consistent with previous Lyα studies (e.g., Reddy et al. 2008; Cassata et al. 2015) at similar redshifts.
Current usage metrics show cumulative count of Article Views (full-text article views including HTML views, PDF and ePub downloads, according to the available data) and Abstracts Views on Vision4Press platform.
Data correspond to usage on the plateform after 2015. The current usage metrics is available 48-96 hours after online publication and is updated daily on week days.
Initial download of the metrics may take a while.