Fig. 5
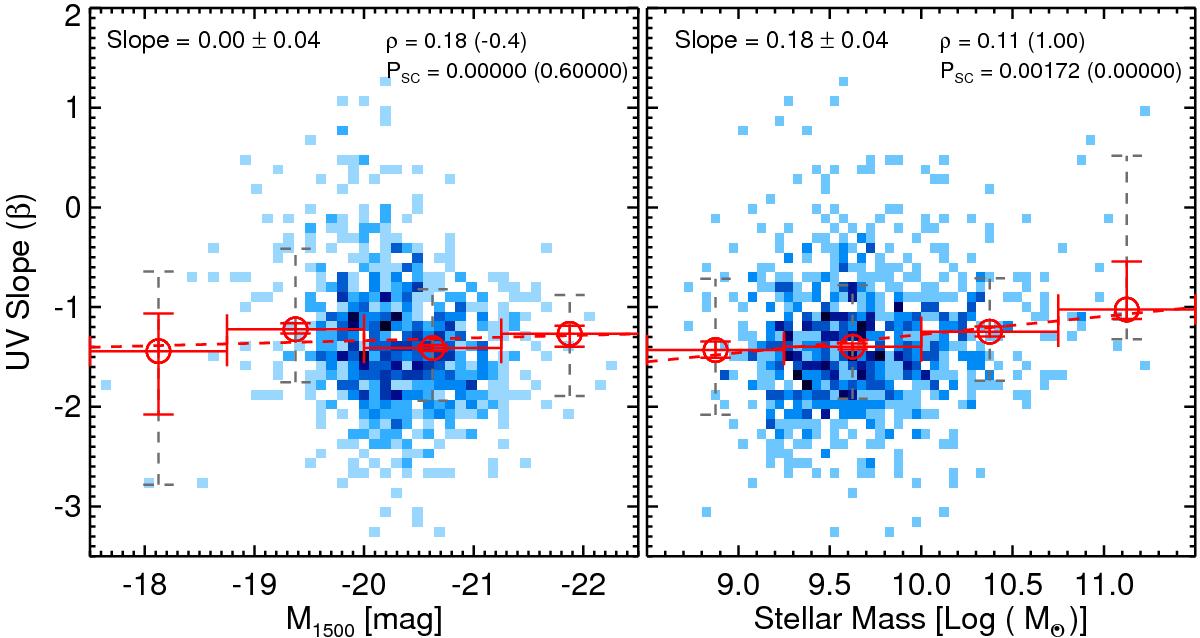
Spectroscopic UV slope versus the UV absolute magnitude (left) and the stellar mass (right). The density of points is color-coded as in previous figures, while the red open circles are the median-binned values for these parameters. The error bars in x illustrate the sizes of the bins, while the errors in y are ±1σ scatter (dashed error bars) corresponding to the range between the 16th and the 84th percentile values within each bin, while smaller solid error bars are the errors on the median values (![]() ). The dashed red lines show the best-fit linear relations. We find no correlation (slope = 0.00 ± 0.04) of β with the UV absolute magnitude, while we see a positive correlation (slope = 0.18 ± 0.04) of β with the stellar mass (redder UV slope for higher mass galaxies). The statistical significance from the Spearman correlation coefficient is shown to confirm these results.
). The dashed red lines show the best-fit linear relations. We find no correlation (slope = 0.00 ± 0.04) of β with the UV absolute magnitude, while we see a positive correlation (slope = 0.18 ± 0.04) of β with the stellar mass (redder UV slope for higher mass galaxies). The statistical significance from the Spearman correlation coefficient is shown to confirm these results.
Current usage metrics show cumulative count of Article Views (full-text article views including HTML views, PDF and ePub downloads, according to the available data) and Abstracts Views on Vision4Press platform.
Data correspond to usage on the plateform after 2015. The current usage metrics is available 48-96 hours after online publication and is updated daily on week days.
Initial download of the metrics may take a while.