Fig. 4
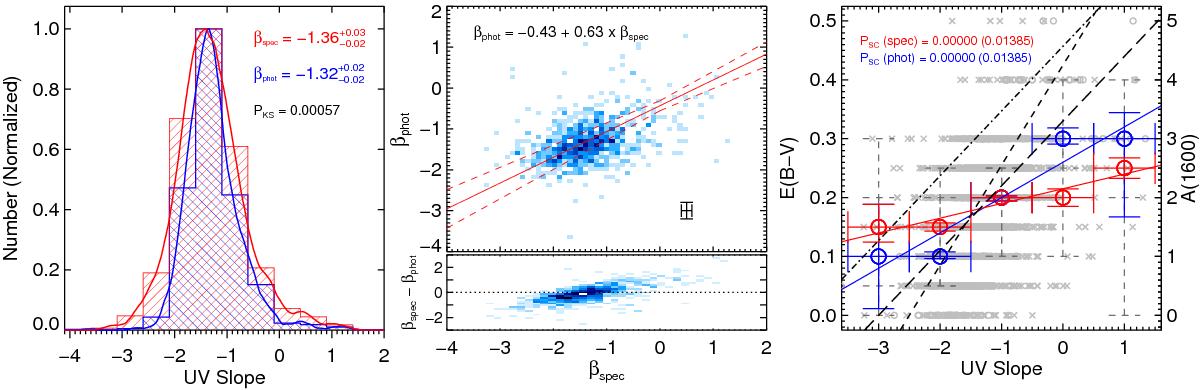
Left: UV spectral slope (β) distribution as measured from the VUDS spectra (red histogram) and the broad-band photometry (blue histogram). The solid curve is the KDE of the distribution. The median β values as well as KS-test probability (PKS) show very small difference in these βs. Middle: βspec versus βphot. The solid red line is the best orthogonal fit relation between these two βs, while the dashed lines show the uncertainties in the best-fit relation. This figure also shows the difference (βspec−βphot) as a function of βspec. The dotted line is for βspec−βphot = 0. The density of points is color-coded as in previous figures. Average uncertainties in these measurements are plotted in the bottom-right corner. Right: the correlation between the UV slope and the SED derived Es(B−V) is such that the redder UV slope implies dustier [higher Es(B−V)] galaxies. The error bars in x illustrate the sizes of the bins, while the errors in y are ±1σ scatter (dashed error bars) corresponding to the range between the 16th and the 84th percentile values within each bin, while the smaller solid error bars are the errors on the median values (![]() ). The red circles are for the spectroscopic β, while the blue circles are for the photometric β. The black small-dashed line is the dust-UV slope relation at 1 ≲ z ≲ 2 from Buat et al. (2012), the black dot-dashed line is the dust-UV slope relation at z ~ 2 from Oteo et al. (2014), and the black long-dashed line is the dust-UV slope relation at 1 < z < 3 from Talia et al. (2015). The background gray points are the values for all galaxies (crosses are βspec and open circles are βphot). The statistical significance from the Spearman correlation coefficient is shown to confirm the correlation. The corresponding A1600 (shown on the right y-axis) is estimated from Es(B−V) using the Calzetti law (A1600 ~ 10 × Es(B−V); Calzetti et al. 2000).
). The red circles are for the spectroscopic β, while the blue circles are for the photometric β. The black small-dashed line is the dust-UV slope relation at 1 ≲ z ≲ 2 from Buat et al. (2012), the black dot-dashed line is the dust-UV slope relation at z ~ 2 from Oteo et al. (2014), and the black long-dashed line is the dust-UV slope relation at 1 < z < 3 from Talia et al. (2015). The background gray points are the values for all galaxies (crosses are βspec and open circles are βphot). The statistical significance from the Spearman correlation coefficient is shown to confirm the correlation. The corresponding A1600 (shown on the right y-axis) is estimated from Es(B−V) using the Calzetti law (A1600 ~ 10 × Es(B−V); Calzetti et al. 2000).
Current usage metrics show cumulative count of Article Views (full-text article views including HTML views, PDF and ePub downloads, according to the available data) and Abstracts Views on Vision4Press platform.
Data correspond to usage on the plateform after 2015. The current usage metrics is available 48-96 hours after online publication and is updated daily on week days.
Initial download of the metrics may take a while.