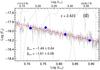
Fig. 3
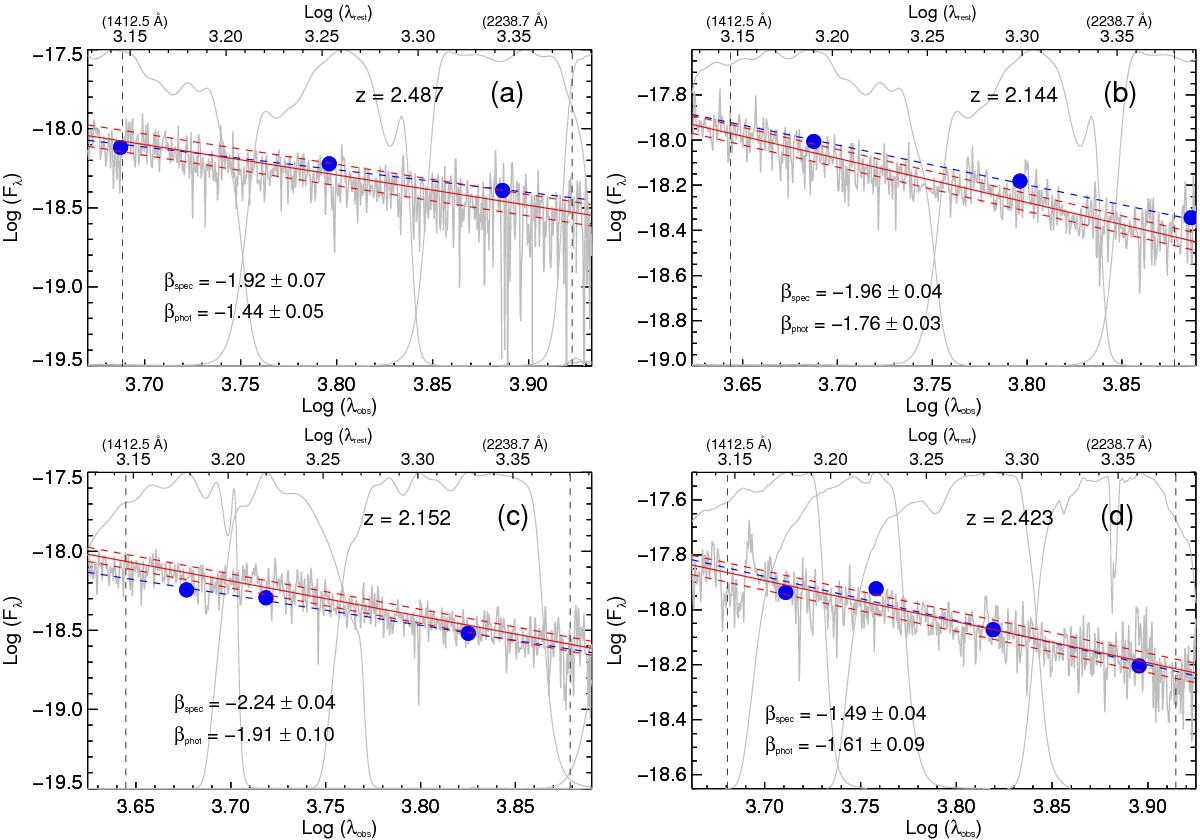
Examples of UV spectral slope (β) fitting on the VUDS spectra (shown in gray). The spectra between rest-frame 1400 Å to 2400 Å (between dashed vertical lines) are fitted with a linear relation (solid red lines) between Log(λ) vs. Log(Fλ) after masking out known lines and removing spurious noise spikes. The dashed red lines are 1σ deviations in the best-fit relation. The blue filled circles are the photometric magnitudes from the broad-band filters (gray curves) used to measure the photometric β, while the blue dashed line is a linear fit between these photometric data points to estimate the photometric UV slope.
Current usage metrics show cumulative count of Article Views (full-text article views including HTML views, PDF and ePub downloads, according to the available data) and Abstracts Views on Vision4Press platform.
Data correspond to usage on the plateform after 2015. The current usage metrics is available 48-96 hours after online publication and is updated daily on week days.
Initial download of the metrics may take a while.