Fig. 2
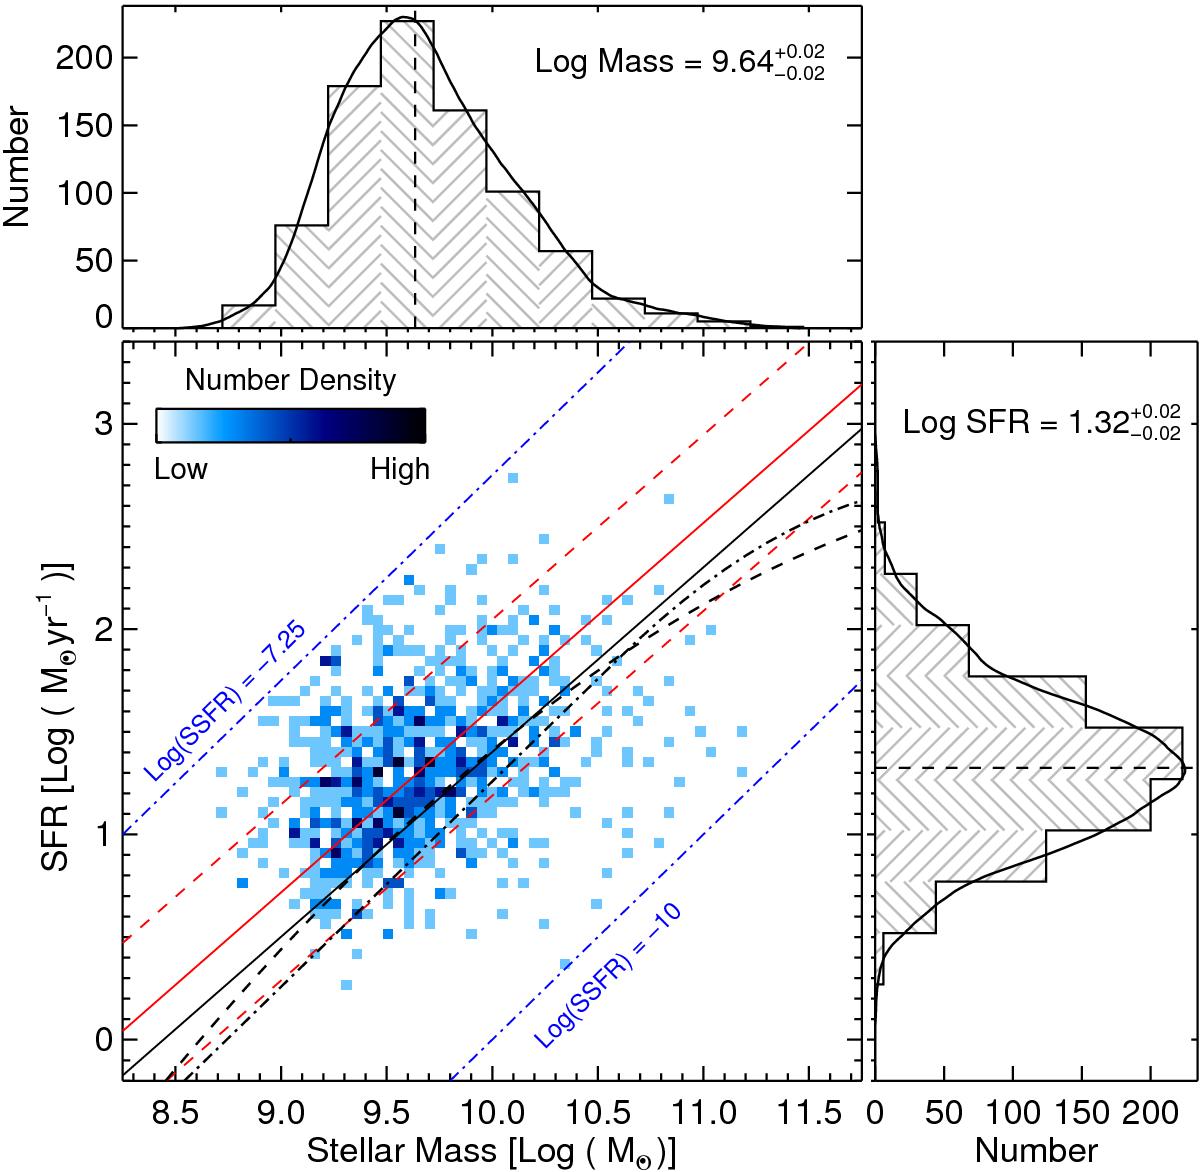
SFR versus stellar mass for SFGs at 2 < z < 2.5 in VUDS. The full sample has median stellar mass of 109.64 ~ 4 × 10⁹M⊙ and median SFR of 101.32 ~ 20 M⊙ per year. The quoted uncertainties are the errors on the median (![]() ) estimated from the 1σ dispersion of the distribution and the total number of galaxies, where ±1σ corresponds to the range between the 16th and the 84th percentile values of the distribution. The black solid curve on the histogram is the KDE of the distribution. The black solid line shows the main sequence of SFGs as defined by Daddi et al. (2007) at z ~ 2, and the solid red line is the best-fit relation (with the slope fixed to the value from Daddi et al.) for our sample with the total scatter (~0.4 dex) shown by red dashed lines. The black dashed line is the main sequence relation from Whitaker et al. (2014), while the black dot-dashed line is the relation from Schreiber et al. (2015). The blue dot-dashed lines show limits on SSFR for these galaxies. The density of points is color-coded as shown in the color-bar.
) estimated from the 1σ dispersion of the distribution and the total number of galaxies, where ±1σ corresponds to the range between the 16th and the 84th percentile values of the distribution. The black solid curve on the histogram is the KDE of the distribution. The black solid line shows the main sequence of SFGs as defined by Daddi et al. (2007) at z ~ 2, and the solid red line is the best-fit relation (with the slope fixed to the value from Daddi et al.) for our sample with the total scatter (~0.4 dex) shown by red dashed lines. The black dashed line is the main sequence relation from Whitaker et al. (2014), while the black dot-dashed line is the relation from Schreiber et al. (2015). The blue dot-dashed lines show limits on SSFR for these galaxies. The density of points is color-coded as shown in the color-bar.
Current usage metrics show cumulative count of Article Views (full-text article views including HTML views, PDF and ePub downloads, according to the available data) and Abstracts Views on Vision4Press platform.
Data correspond to usage on the plateform after 2015. The current usage metrics is available 48-96 hours after online publication and is updated daily on week days.
Initial download of the metrics may take a while.