Fig. 10
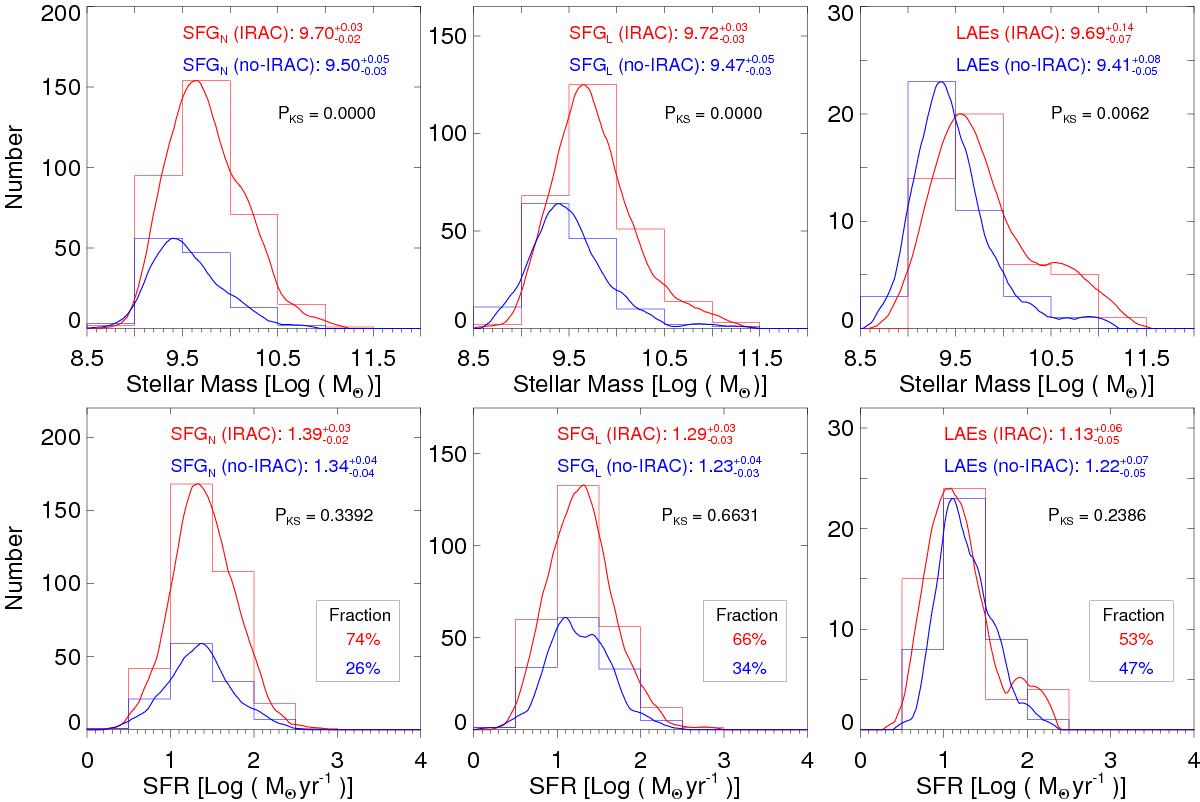
Comparison between Spitzer/IRAC 3.6 μm-detected (red; brighter than m3.6 ~ 25 mag) and IRAC-undetected (blue; fainter than m3.6 ~ 25 mag) galaxies as function of stellar mass and SFR for SFGN, SFGL, and LAEs. The fraction of galaxies detected/un-detected in IRAC are shown in the legend. The solid curve is the KDE of the distribution. The statistical significance based on the KS test is shown to confirm the observed correlation.
Current usage metrics show cumulative count of Article Views (full-text article views including HTML views, PDF and ePub downloads, according to the available data) and Abstracts Views on Vision4Press platform.
Data correspond to usage on the plateform after 2015. The current usage metrics is available 48-96 hours after online publication and is updated daily on week days.
Initial download of the metrics may take a while.