Fig. 9
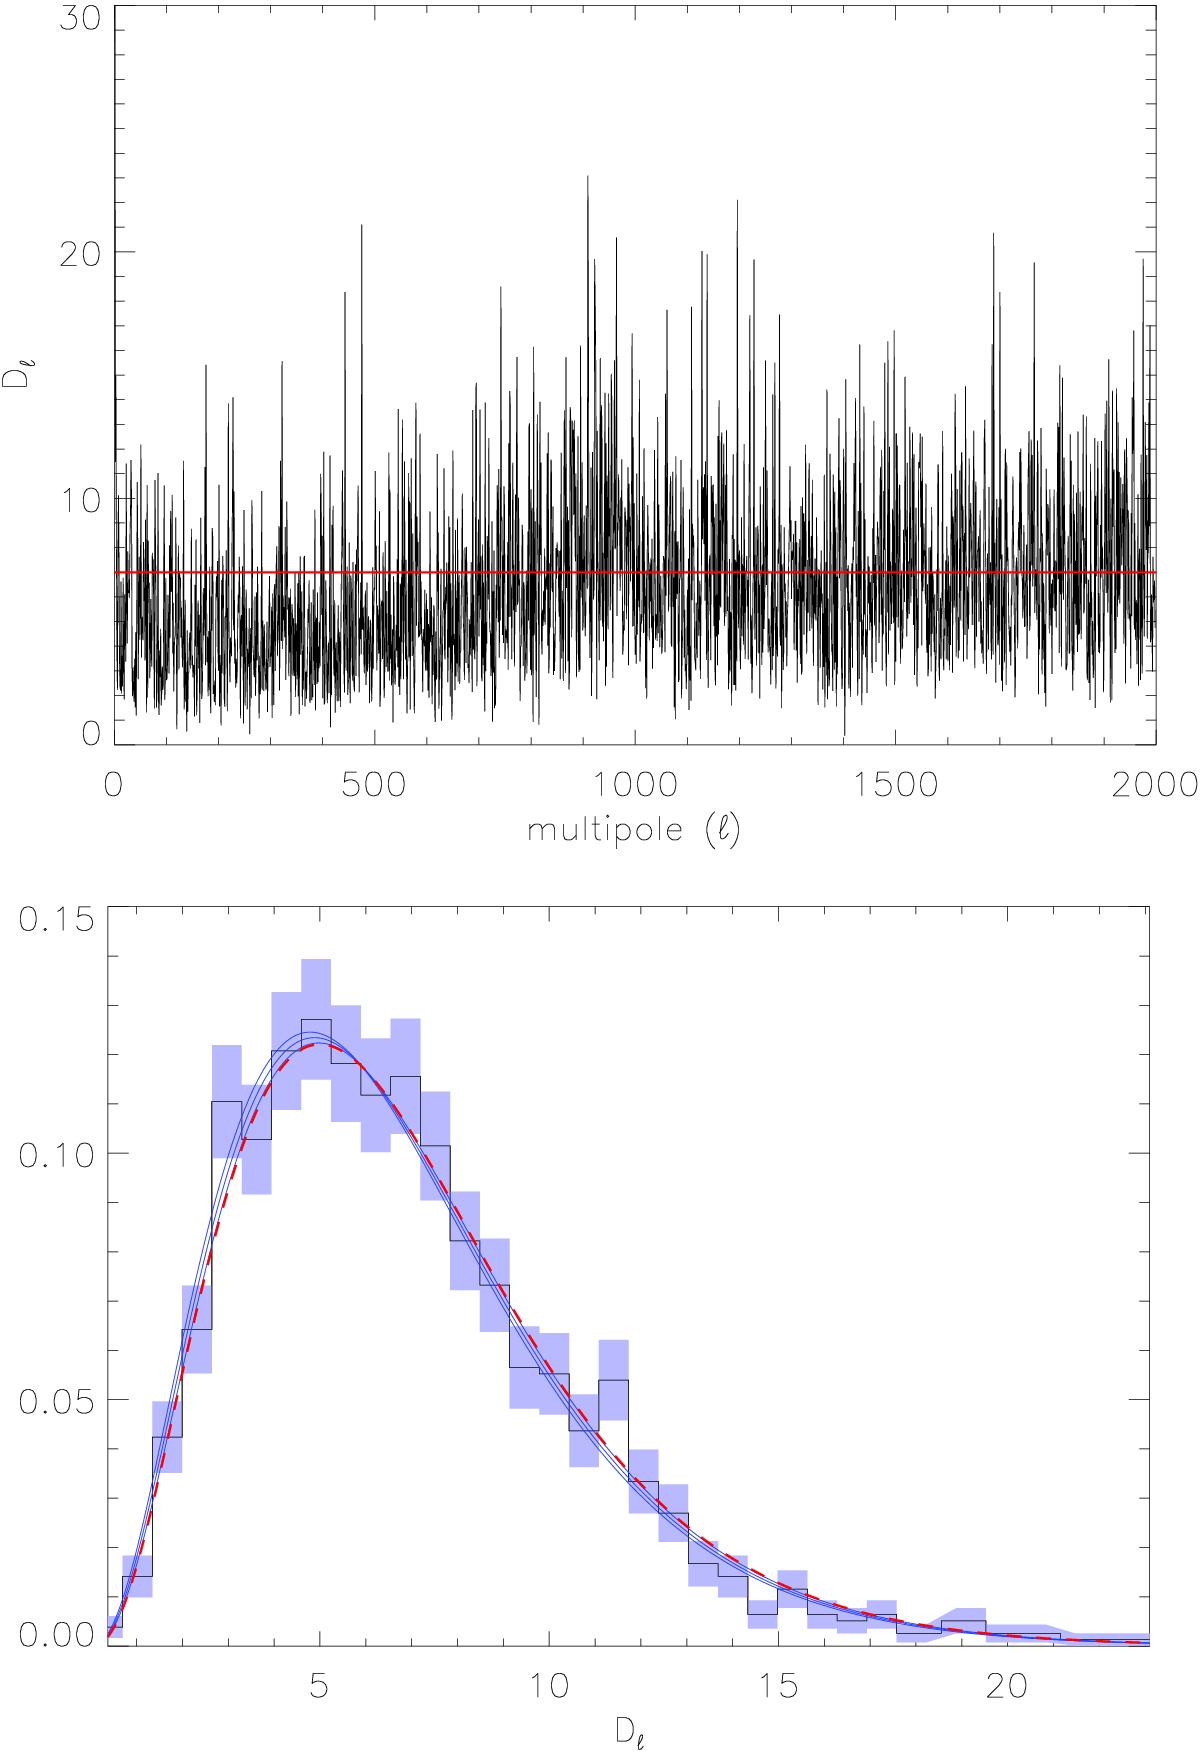
Mismatch between the data and the result of a sampler that includes the input correlations between the components during the sampling process (top) and its PDF (bottom). In the upper panel the red line represents the mean of the expected chi-squared distribution that Dℓ should follow. In the bottom panel, the blue lines are the best χ2-fit to a chi-squared curve and the ± 1 standard deviation error from the fit. The red dashed line represents the chi-squared distribution with the expected number of degrees of freedom Nd.o.f. = 7. The introduction of the correlation between the input component erases the large discrepancy at low multipole.
Current usage metrics show cumulative count of Article Views (full-text article views including HTML views, PDF and ePub downloads, according to the available data) and Abstracts Views on Vision4Press platform.
Data correspond to usage on the plateform after 2015. The current usage metrics is available 48-96 hours after online publication and is updated daily on week days.
Initial download of the metrics may take a while.