Fig. 5
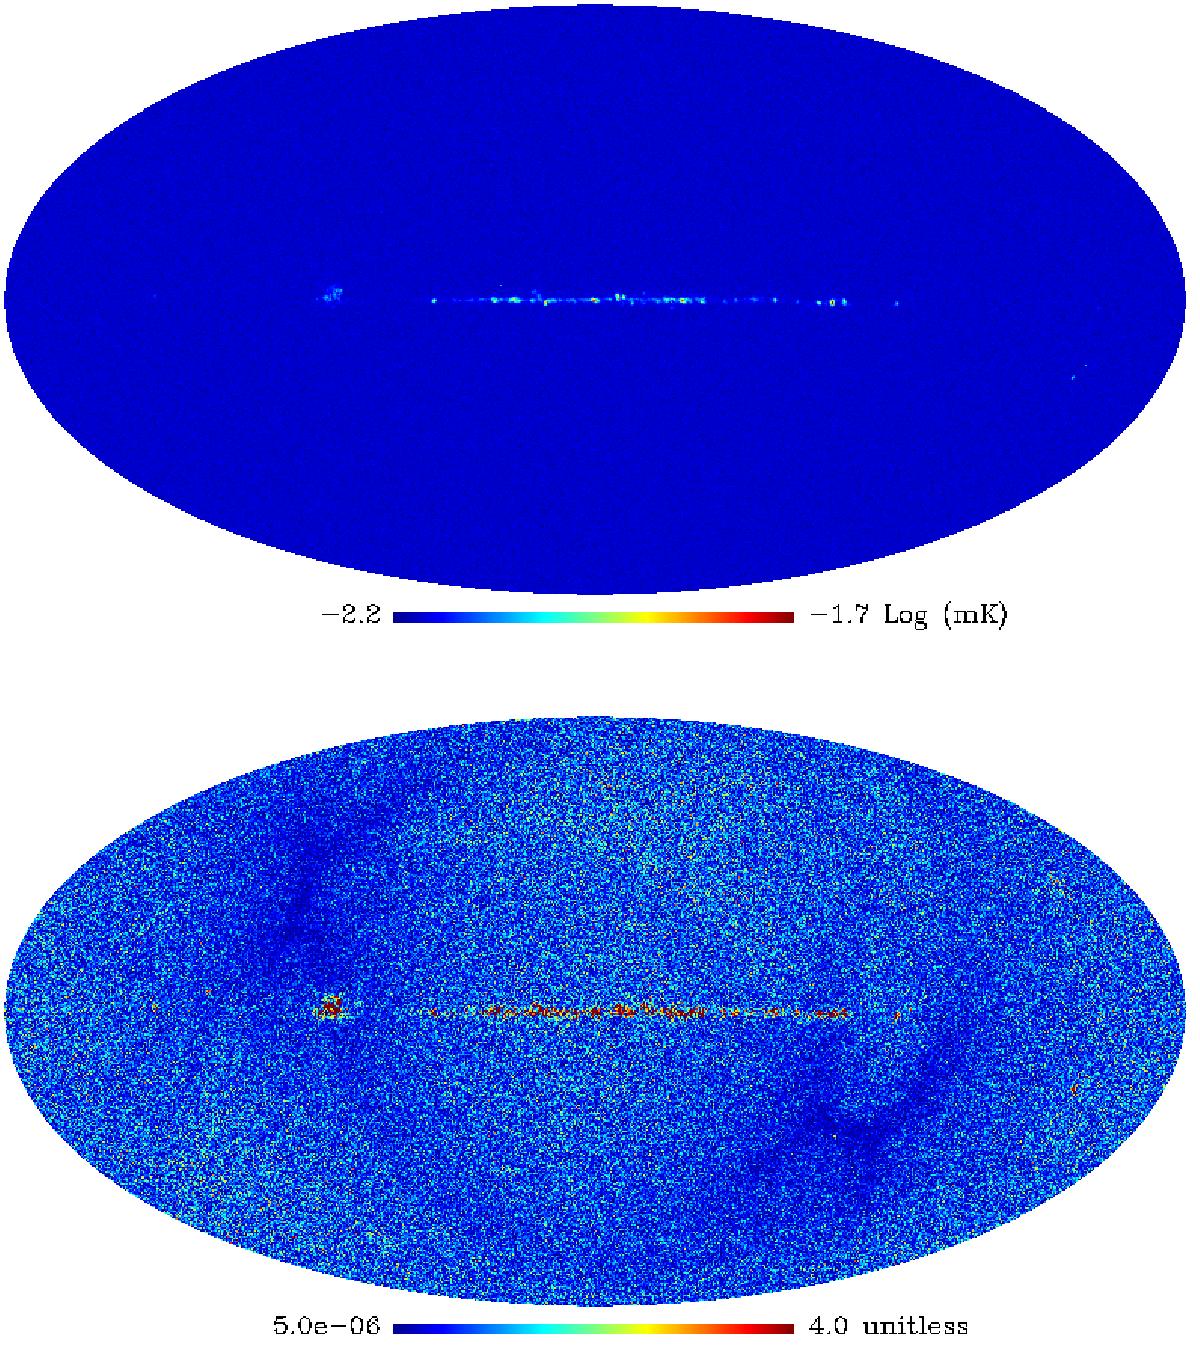
Top: standard deviation map of the CMB map samples. The posterior distribution is wider in the region of the galactic plane. Bottom: standardized error map, all red pixels have a value of 4 or more. This map is the ratio between the residual map of the CMB and its standard deviation map (top). The posterior standard deviation map only represents the part of the uncertainty that is uncorrelated from pixel to pixel, while the Bayesian analysis returns a fully correlated error model for the recovered map shown in Fig. 4. Standardizing with the uncorrelated errors reveals two things: the isotropic noise approximation leads to overestimated uncertainties in low noise regions, and an uncorrelated error model does not capture the uncertainties in regions where foregrounds dominate. See Fig. 6 for a visualization of correlated uncertainties.
Current usage metrics show cumulative count of Article Views (full-text article views including HTML views, PDF and ePub downloads, according to the available data) and Abstracts Views on Vision4Press platform.
Data correspond to usage on the plateform after 2015. The current usage metrics is available 48-96 hours after online publication and is updated daily on week days.
Initial download of the metrics may take a while.