Fig. 3
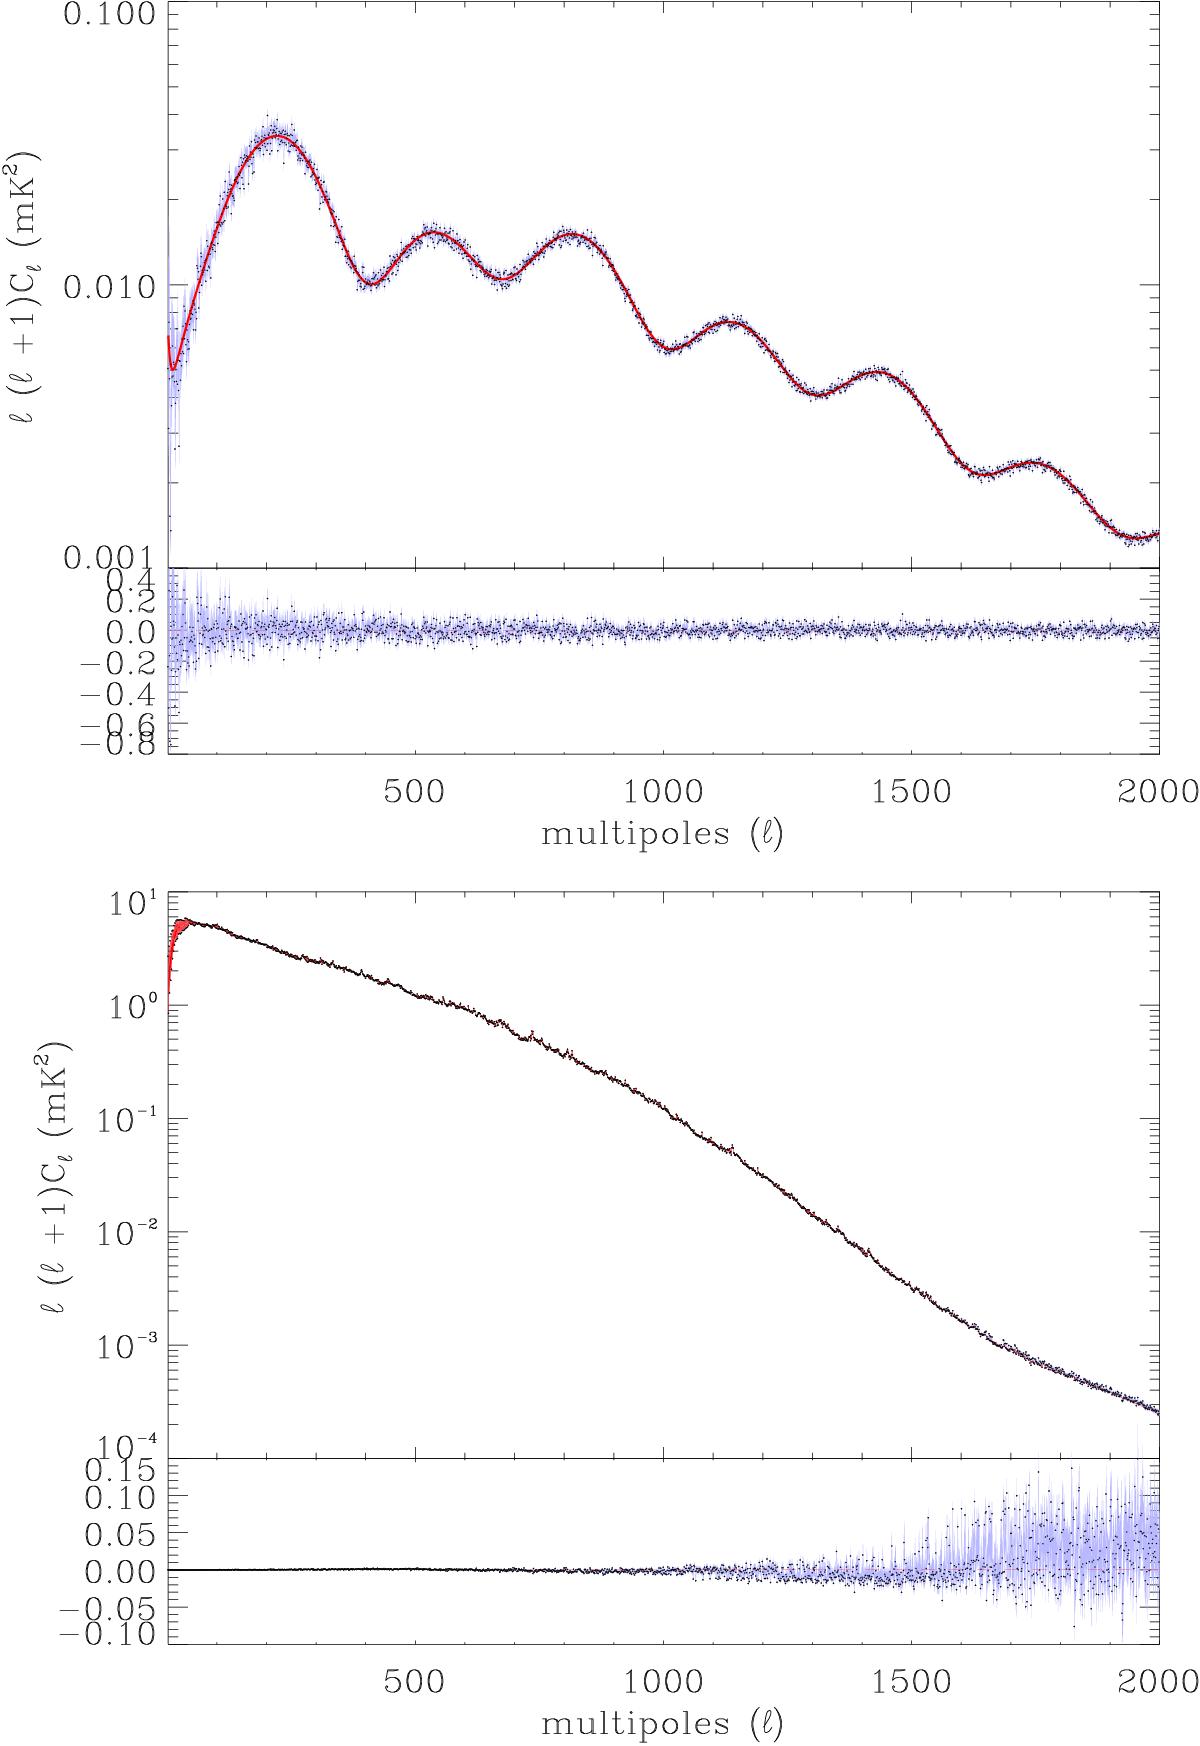
Input and inferred power spectra of the CMB (top) and the sum of the non-CMB components (bottom). In the upper panel of each figure, the black dot at each multipole represents the peaks of the marginal posterior, the gray region shows the asymmetric ± 1σ-error bar derived from the marginal posterior, the red line is the input power spectrum. The lower panel represents the relative error to the input power spectrum. The sampler accurately recovers the power spectra of the CMB.
Current usage metrics show cumulative count of Article Views (full-text article views including HTML views, PDF and ePub downloads, according to the available data) and Abstracts Views on Vision4Press platform.
Data correspond to usage on the plateform after 2015. The current usage metrics is available 48-96 hours after online publication and is updated daily on week days.
Initial download of the metrics may take a while.