Fig. 1
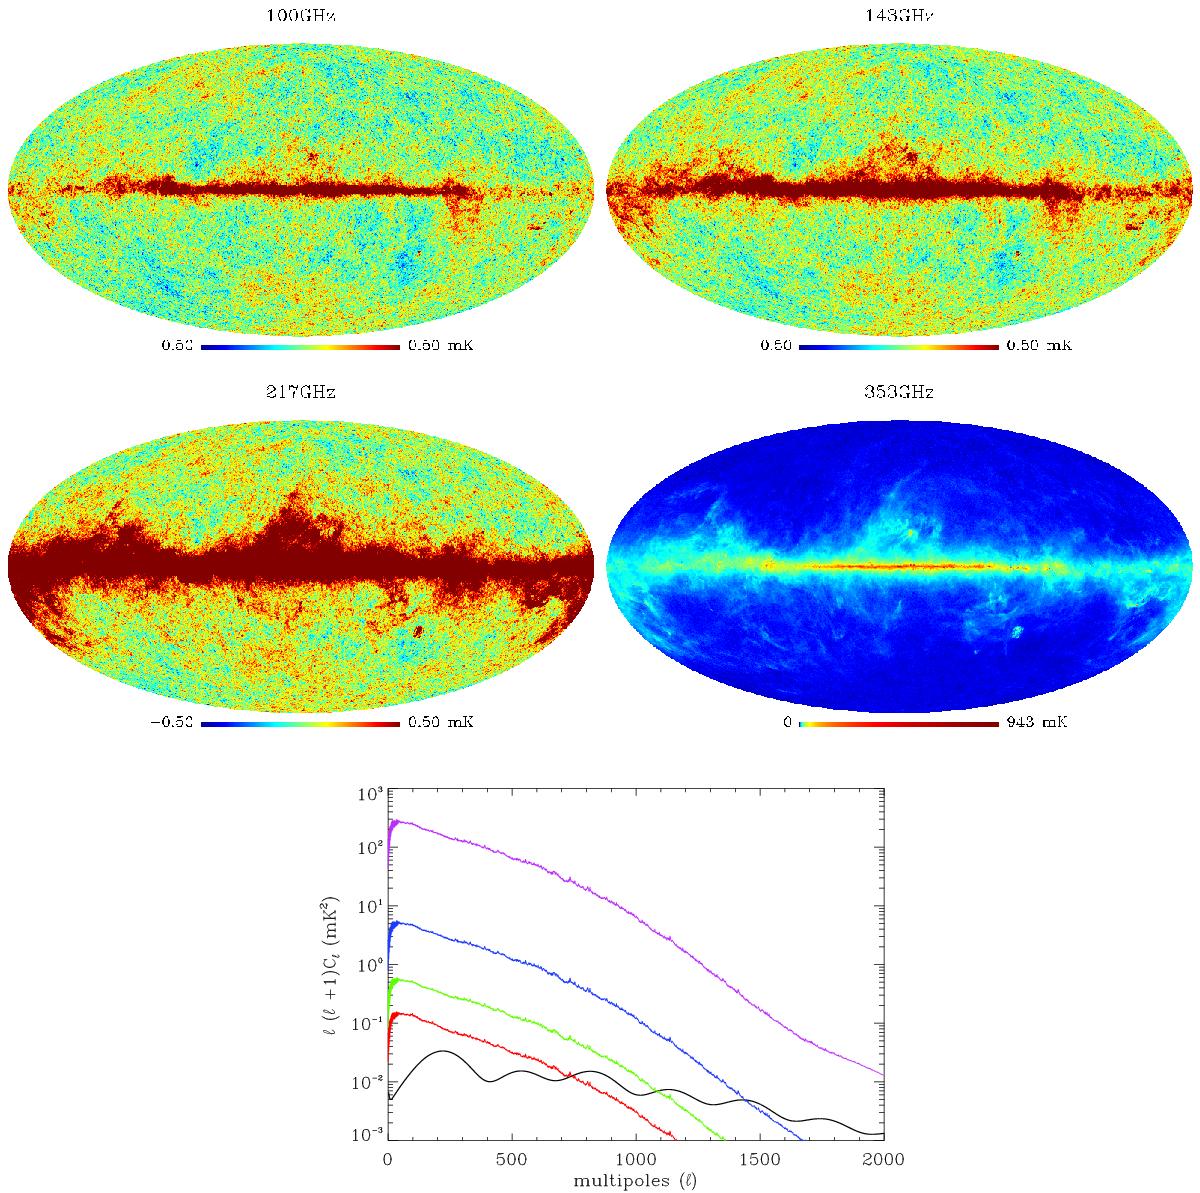
Simulated data maps at four of the Planck HFI frequencies from 100 GHz to 353 GHz using realistic spatial distributions of free-free and thermal dust emissions from the PSM. In these simulated data maps the templates of the component maps are scaled through frequency according to the mixing matrix. This set of channels was chosen because the CMB is the least contaminated by foregrounds and noise in this frequency range. The plot shows the power spectrum of the CMB (black line) and the level of foreground at each frequency channel (from red to purple is 100 GHz to 353 GHz).
Current usage metrics show cumulative count of Article Views (full-text article views including HTML views, PDF and ePub downloads, according to the available data) and Abstracts Views on Vision4Press platform.
Data correspond to usage on the plateform after 2015. The current usage metrics is available 48-96 hours after online publication and is updated daily on week days.
Initial download of the metrics may take a while.