| Issue |
A&A
Volume 587, March 2016
|
|
|---|---|---|
| Article Number | L3 | |
| Number of page(s) | 4 | |
| Section | Letters | |
| DOI | https://doi.org/10.1051/0004-6361/201527910 | |
| Published online | 15 February 2016 | |
H I observations of two new dwarf galaxies: Pisces A and B with the SKA Pathfinder KAT-7⋆
1
Department of Astronomy, University of Cape Town,
Private Bag X3, 7701
Rondebosch, South
Africa
e-mail:
This email address is being protected from spambots. You need JavaScript enabled to view it.
2 Observatoire d’Astrophysique de l’Université de Ouagadougou,
BP 7021, Ouagadougou 03, Burkina Faso
3
Netherlands Institute for Radio Astronomy (ASTRON),
Postbus 2, 7990 AA
Dwingeloo, The
Netherlands
4
Kapteyn Astronomical Institute, University of
Groningen, PO Box
800, 9700 AV
Groningen, The
Netherlands
5
Space Telescope Science Institute, 3700 San Martin Dr, Baltimore, MD
21218,
USA
Received: 7 December 2015
Accepted: 3 January 2016
Abstract
Context. Pisces A and Pisces B are the only two galaxies found via optical imaging and spectroscopy out of 22 Hi clouds identified in the GALFAHI survey as dwarf galaxy candidates.
Aims. We derive the Hi content and kinematics of Pisces A and B.
Methods. Our aperture synthesis Hi observations used the seven-dish Karoo Array Telescope (KAT-7), which is a pathfinder instrument for MeerKAT, the South African precursor to the mid-frequency Square Kilometre Array (SKA-MID).
Results. The low rotation velocities of ~5 km s-1 and ~10 km s-1 in Pisces A and B, respectively, and their Hi content show that they are really dwarf irregular galaxies (dIrr). Despite that small rotation component, it is more the random motions ~9−11 km s-1 that provide most of the gravitational support, especially in the outer parts. The study of their kinematics, especially the strong gradients of random motions, suggest that those two dwarf galaxies are not yet in equilibrium.
Conclusions. These Hi- rich galaxies may be indicative of a large population of dwarfs at the limit of detectability. However, such gas-rich dwarf galaxies will most likely never be within the virial radius of MW-type galaxies and become subhalo candidates. Systems such as Pisces A and B are more likely to be found at a few Mpc s from MW-type galaxies.
Key words: galaxies: dwarf / galaxies: individual: Pisces A / galaxies: individual: Pisces B / ISM: kinematics and dynamics / galaxies: kinematics and dynamics
The final FITS cube is only available at the CDS via anonymous ftp to cdsarc.u-strasbg.fr (130.79.128.5) or via http://cdsarc.u-strasbg.fr/viz-bin/qcat?J/A+A/587/L3
© ESO, 2016
1. Introduction
Optical searches for faint dwarf galaxies and satellites (dSph or dIrr) are generally limited by surface brightness. While having some success recently for very nearby dwarfs in deep optical surveys, such as the Dark Energy Survey (Koposov et al. 2015) and the PAN-STARRS 1 3π Survey (Laevens et al. 2015), the task becomes very difficult as soon as one gets farther out in the Local Volume (5−10 Mpc). This was shown clearly with the discovery of seven dwarf galaxies close to M101, which have central surface brightnesses of μg ~ 25.5 − 27.5 mag arcsec-2, well below the sky brightness, and was only possible through the development of a new instrument, the Dragonfly Telephoto Array (Merritt et al. 2014).
This motivates searches for dwarf galaxies using the 21 cm emission line of neutral hydrogen (Hi). While such searches cannot identify passive dwarf galaxies (dSph), such as most Local Group satellites, which lack Hi (MHi/LV ≤ 10-3 M⊙/L⊙: Spekkens et al. 2014), they have the potential of finding gas-rich, potentially star-forming dwarf (dIrr) galaxies (see, e.g., Adams et al. 2013, 2015; Cannon et al. 2015; Janowiecki et al. 2015).
Good examples are the dwarf galaxies Leo P, found first in Hi (Giovanelli et al. 2013) and later confirmed by optical imaging (Rhode et al. 2013), and Leo T, first detected in Hi by HIPASS (Wong et al. 2006) but discovered independently in the optical a year later by Irwin et al. (2007). However, those galaxies detected in Hi cannot alleviate the missing satellite problem and be subhalo candidates, since Leo T at ~400 kpc (McConnachie 2012), for example, is outside the virial radius of the Milky Way (MW) and Leo P at ~ 1.5−2.0 Mpc (McQuinn et al. 2013) is well outside the Local Group. Possible subhalos that could be associated to the MW or M31 are more likely dSphs stripped of their gas (Grcevich & Putman 2003) or completely “dark” systems (Brooks et al. 2013).
Tollerud et al. (2015), hereafter TOL15, report the discovery of two dwarf galaxies, Pisces A and B, from a blind 21 cm Hi search. These were the only two galaxies found via optical imaging and spectroscopy (WIYN) out of 22 Hi clouds identified in the GALFAHI survey (Peek et al. 2011) as dwarf galaxy candidates. While the distance uncertainty made any interpretation ambiguous at the time, TOL15 propose that they are likely within the Local Volume (<10 Mpc) but outside of the Local Group (>1 Mpc). They also suggest that they may be among the faintest star-forming dwarf galaxies known.
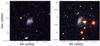 |
Fig. 1 SDSS combined gri images of Pisces A (left) and B (right). |
Figure 1 shows SDSS (gri) images of Pisces A and B. That the brightest stars are being resolved in Pisces A already suggests that it is most likely closer than Pisces B. Table 1 summarizes the parameters of the two new dwarf galaxies, using the new determined distances of Tollerud et al. (2016). The remainder of this letter is as follows. Section 2 gives a description of the Karoo Array Telescope (KAT-7) observations and data reduction, Sect. 3 describes the Hi content and kinematics of Pisces A and B, the main results are discussed in Sects. 4, and 5 presents the final conclusion.
Parameters of Pisces A and B.
2. KAT-7 observations and data reduction
The observations were obtained with the seven-dish KAT-7 array (Carignan et al. 2013; Lucero et al. 2015), located close to the South African SKA core site in the Northern Cape’s Karoo desert region. The array is extremely compact, with baselines ranging from 26 m to 185 m and receivers having a very low Tsys ~ 26 K, which makes it very sensitive to large scale, low surface brightness emission. The parameters of the KAT-7 observations are given in Table 2. The data were collected between 2014 November 27 and 2014 December 16 in the c16n13M4K spectral line mode. This correlator mode gives velocity channels of 0.64 km s-1 over a flat bandpass of ~2000 km s-1. When producing the final cubes, we averaged five channels for a final channel width of 3.2 km s-1.
Each of the observing sessions of typically six hours were reduced separately. All data were calibrated using standard calibration tasks in the Common Astronomy Software Applications (CASA 4.2.0) package (McMullin et al. 2007). Phase drifts as a function of time were corrected by means of a nearby point source (0022+002) observed every 30 min. This source was also used to correct for variations in the gain as a function of frequency (bandpass calibration). The absolute flux scale was set by observing 1934-638. Comparisons of the flux measurements on the observed calibrators suggest that the absolute flux uncertainties are on the order of 5%. Variations in the bandpass are on the order of 1%.
Continuum emission was subtracted from the raw UV data by making first-order fits to the line-free channels using the CASA task uvcontsub. The calibration was then applied and Pisces A and B were split from the calibration sources. KAT-7 does not use doppler tracking, and CASA does not fully recognize frequency keywords, so special care was taken to produce uv data sets and test cubes with the proper velocity coordinates (see Carignan et al. 2013). The individually calibrated continuum-subtracted UV data sets were then combined using the CASA task concat.
Preliminary imaging of the combined data in CASA revealed the presence of artifacts in the form of horizontal lines, which were caused by some unidentified internal instrumental feature. At the suggestion of T. A. Oosterloo, these were removed by flagging all visibilities near u = 0 (see also Hess et al. 2015), clearly seen to be out of range after performing an FFT on the images. Careful data analysis also allowed us to discover and correct for an artifact caused by crosstalk between two antennas. This occurs when one antenna is pointing toward the back of another at an elevation high enough to prevent the shadowing flag to be triggered by the system, but low enough to produce strong variations in the bandpass.
Parameters of the KAT–7 observations.
3. H I content and kinematics
The total Hi distribution maps of Pisces A and B, shown in Fig. 2, were derived using the task sqash in AIPS (Greisen 2003). They are superposed on the WISE (w1+w2+w3) and Galex (NUV) images. As expected, not much IR flux is seen in the WISE images due to the absence of an appreciable old stellar population (Pisces A is not detected in WISE, but Pisces B is, which suggests it has a higher stellar mass) but the two star-forming dwarfs are clearly seen in the UV. The faintest level goes down to ~3 × 1018 cm-2. At that level, the galaxies have diameters of ~9.6′ and ~8.5′, respectively. Owing to the northern declinations of the sources, the synthesized beam is larger. However, there are still about two to three beams across the objects, which is sufficient to detect any significant velocity gradient.
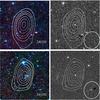 |
Fig. 2 Hi distributions in Pisces A (top) and Pisces B (bottom), superposed on the 3-color WISE w1+w2+w3 composite (left) and Galex NUV (right) images from the natural weighted cubes. Contours are at 0.3 (3σ), 0.6, 1.2, 1.8, 2.4, and 3.0 × 1019 cm-2. |
The global Hi profiles are given in Fig. 3. They were obtained using the task blsum in AIPS. Mid-point velocities (50% level) of 233 ± 3 km s-1 and 617 ± 3 km s-1 are found for Pisces A and Pisces B, respectively. These can be compared to 236 ± 0.5 km s-1 and 615 ± 1 km s-1 found by TOL15. The profile widths at the 50% levels are ΔVA = 28 ± 3 km s-1 and ΔVB = 41 ± 3 km s-1, compared to ΔVA = 22.5 ± 1.3 km s-1 and ΔVB = 43 ± 3 km s-1 for TOL15. Total Hi fluxes of 1.68 ± 0.20 and 1.76 ± 0.05 Jy km s-1 are found, corresponding to Hi masses of 4.0 ± 0.5 × 10⁵ M⊙ and 4.2 ± 0.2 × 10⁵ M⊙ at a fiducial distance of 1.0 Mpc. This is slightly larger than the values of 2.8 ± 0.2× 10⁵ M⊙ and 3.8 ± 0.4 × 10⁵ M⊙ found by TOL15. At the adopted distance, this corresponds to total Hi masses of 1.3 ± 0.4 × 10⁷ and 3.3 ± 1.0 × 10⁷ M⊙ for Pisces A and B.
It is difficult to understand the difference for Pisces A (~30% in flux and ~20% in width), while both data sets agree perfectly in the case of Pisces B, since the same calibrators and techniques were used for both objects. Comparing the global profiles, the difference is clearly on the approaching side. However, we are quite confident in the width derived for Pisces A since the value obtained by TOL15 would imply that no rotation is present, while rotation is clearly seen in the velocity field of Pisces A (Fig. 4).
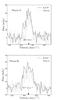 |
Fig. 3 Global Hi profiles of Pisces A (top) and Pisces B (bottom), using the natural weighted cubes. Velocities are heliocentric. The gray profiles are those from TOL15. |
From the moment analysis, derived with the task momnt in AIPS, the mean σ (random motion) of the Hi is 9.4 ± 2.0 km s-1 for Pisces A and 11.0 ± 3.7 km s-1 for Pisces B. For Pisces A, there is a gradient from ~6 km s-1 in the north to ~12 km s-1 in the south and for Pisces B from ~15 km s-1 in the center down to ~7 km s-1 at the edge of the disk. The global profiles show that some rotation is clearly present on the order of (7 ± 3)/2(sin i) ~ 4.6 ± 2.0 km s-1 and (17 ± 3)/2(sini) ~ 9.4 ± 2.1 km s-1 for Pisces A and B. This is exactly what is seen in the velocity fields of Fig. 4, obtained by Gaussian profile fitting using the task xgaus in AIPS. The derived Hi parameters are given in Table 3.
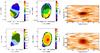 |
Fig. 4 Velocity fields (the dashed line shows the optical PA) from Gaussian profiles fitting (left), velocity dispersion from moment analysis (center), and PV diagrams of the Hanning-smoothed data for Pisces A (top) and B (bottom), where the dashed lines show the systemic velocities. |
Hi parameters of Pisces A and B.
4. Discussion
What we can see from the derived velocity fields is that, while the disks are fairly regular on the approaching (blue) sides, they are strongly warped on the receding (red) sides. This asymmetry, combined with the strong gradient of velocity dispersion, shows clearly that those disks are not yet in equilibrium. An alternative scenario could be that some minor amount of accretion is happening in the outer regions, while the inner disks are fairly well in equilibrium. Pisces A and B are among the few non-elliptical (non-dSph) systems known at MB ~ − 11, such as GR8 (Carignan et al. 1990) in the Local Group and M81dwA (Sargent et al. 1983) where rotation is providing some gravitational support in the inner parts, while random motions provide essentially all the support in the outer parts. M81dwA has a rotation ~3 km s-1 similar to Pisces A, and GR8 has a rotation of ~8 km s-1 of the same order as Pisces B.
When the KAT-7 Hi observations started, the distances to Pisces A and B were unknown. Now that the distances are known, it is clear that those galaxies are not candidates for subhalos of more massive MW-type galaxies. In the case of more likely subhalo candidates, such as the nine ultra faint dwarfs (UFD) uncovered by the Dark Energy Survey (Koposov et al. 2015), none of them were detected in Hi (Westmeier et al. 2015).
Knowing the distances also revealed that Pisces A and B are quite different from Leo T and P, despite very similar HI fluxes. In fact, they are both much brighter with absolute V magnitudes of −11.57 and −12.90, compared to −7.1 (Irwin et al. 2007) and − 9.3 (Rhode et al. 2013) and have a much larger Hi content of a few × 107 M⊙, compared to a few × 105 M⊙ for the less distant Leo T and Leo P.
5. Conclusion
All isolated dwarfs (i.e., those that are not satellites of a larger galaxy, such as the Milky Way or M 31) are actually richer in cold gas than larger galaxies (Geha et al. 2012), and in fact, the smaller are such isolated dwarfs, the richer in cold gas they become (Huang et al. 2012). Some recent theoretical work (see, e.g., Bovill & Ricotti 2011a,b) does indeed suggest that an extensive population of still undiscovered gas-dominated or even dark dwarfs may exist in the outer fringes of the Local Group or just beyond.
An examination of the dwarf galaxies within the full ALFALFA population in the context of global star formation (SF) laws (Huang et al. 2012) is consistent with the general assumptions that gas-rich galaxies have lower SF efficiencies than do optically selected populations and that Hi disks are more extended than stellar ones. Pisces A and B are good examples of this.
Acknowledgments
We thank all the team of SKA South Africa for allowing us to obtain scientific data during the commissioning phase of KAT-7. The work of C.C. an T.J. is based upon research supported by the South African Research Chairs Initiative (SARChI) of the Department of Science and Technology (DST), the Square Kilometre Array South Africa (SKA SA) and the National Research Foundation (NRF). The research of Y.L., D.L., & T.R. has been supported by SARChI, SKA SA fellowships.
References
- Adams, E. A. K.,Giovanelli, R., & Haynes, M. P. 2013, ApJ, 768, 77 [NASA ADS] [CrossRef] [Google Scholar]
- Adams, E. A. K., Faerman, Y., Janesh, W. F., et al. 2015, A&A, 573, L3 [NASA ADS] [CrossRef] [EDP Sciences] [Google Scholar]
- Bovill, M. S., & Ricotti, M. 2011a, ApJ, 741, 17 [NASA ADS] [CrossRef] [Google Scholar]
- Bovill, M. S., & Ricotti, M. 2011b, ApJ, 741, 18 [NASA ADS] [CrossRef] [Google Scholar]
- Brooks, A. M., Kuhlen, M., Molotov, A., & Hooper, D. 2013, ApJ, 765, 22 [Google Scholar]
- Cannon, J. M., Martinkus, C. P., Leisman, L., et al. 2015, AJ, 149, 72 [NASA ADS] [CrossRef] [Google Scholar]
- Carignan, C., Beaulieu, S., & Freeman, K. C. 1990, AJ, 99, 1 [Google Scholar]
- Carignan, C., Frank, B. S., Hess, K. M., et al. 2013, AJ, 146, 48 [NASA ADS] [CrossRef] [Google Scholar]
- Geha, M., Blanton, M. R., Yan, R., & Tinker, J. L. 2012, ApJ, 757, 85 [NASA ADS] [CrossRef] [Google Scholar]
- Giovanelli, R., Haynes, M. P., Adams, E. A. K., et al. 2013, AJ, 146, 15 [NASA ADS] [CrossRef] [Google Scholar]
- Grcevich, J., & Putman, M. E. 2009, ApJ, 696, 385 [NASA ADS] [CrossRef] [Google Scholar]
- Greisen, E. W. 2003, Astrophys. Space Sci. Libr., 285, 109 [Google Scholar]
- Hess, K. M., Jarrett, T., Carignan, C., Passmoor, S. S., & Goedhart, S. 2015, MNRAS, 452, 1617 [NASA ADS] [CrossRef] [Google Scholar]
- Huang, S., Haynes, M. P., Giovanelli, R., et al. 2012, AJ, 143, 133 [NASA ADS] [CrossRef] [Google Scholar]
- Irwin, M. J., Belokurov, V., Evans, N. W., et al. 2007, ApJ, 656, L13 [NASA ADS] [CrossRef] [MathSciNet] [Google Scholar]
- Janowiecki, S., Leisman, L., Józsa, G., et al. 2015, ApJ, 801, 96 [NASA ADS] [CrossRef] [Google Scholar]
- Koposov, S. E., Belokurov, V., Torrealba, G., & Evans, N. W. 2015, ApJ, 805, 130 [NASA ADS] [CrossRef] [Google Scholar]
- Laevens, B. P. M., Martin, N. F., Bernard, E. J., et al. 2015, ApJ, 813, 44 [NASA ADS] [CrossRef] [Google Scholar]
- Lucero, D. M., Carignan, C., Elson, E. C., et al. 2015, MNRAS, 450, 3935 [NASA ADS] [CrossRef] [Google Scholar]
- McConnachie, A. W. 2012, AJ, 144, 4 [NASA ADS] [CrossRef] [Google Scholar]
- McMullin, J. P., Waters, B., Schiebel, D., Young, W., & Golap, K. 2007, ASP Conf. Ser., 376, 127 [Google Scholar]
- McQuinn, K. B. W., Skillman, E. D., Berg, D., et al. 2013, AJ, 146, 145 [NASA ADS] [CrossRef] [Google Scholar]
- Merritt, A., van Dokkum, P., & Abraham, R. 2014, ApJ, 787, L37 [NASA ADS] [CrossRef] [Google Scholar]
- Peek, J. E. G., Heiles, C., Douglas, K. A., et al. 2011, ApJS, 194, 20 [NASA ADS] [CrossRef] [Google Scholar]
- Rhode, K. L., Salzer, J. J., Haurberg, N. C., et al. 2013, AJ, 145, 149 [NASA ADS] [CrossRef] [Google Scholar]
- Sargent, W. L. W., Sancisi, R., & Lo, K.-Y. 1983, ApJ, 265, 711 [NASA ADS] [CrossRef] [Google Scholar]
- Spekkens, K., Urbancic, N., Mason, B., Willman, B., & Aguirre, J. E. 2014, ApJ, 795, L5 [NASA ADS] [CrossRef] [Google Scholar]
- Tollerud, E. J., Geha, M. C., Grcevich, J., Putman, M. E., & Stern, D. 2015, ApJ, 798, L21 (TOL15) [NASA ADS] [CrossRef] [Google Scholar]
- Tollerud, E. J., Geha, M. C., Grcevich, J., et al. 2016, ApJ, submitted [Google Scholar]
- Westmeier, T., Staveley-Smith, L., Calabretta, M., et al. 2015, MNRAS, 453, 338 [NASA ADS] [CrossRef] [Google Scholar]
- Wong, O. I., Ryan-Weber, E. V., Garcia-Appadoo, D. A., et al. 2006, MNRAS, 371, 1855 [NASA ADS] [CrossRef] [Google Scholar]
All Tables
All Figures
|
Fig. 1 SDSS combined gri images of Pisces A (left) and B (right). |
| In the text | |
|
Fig. 2 Hi distributions in Pisces A (top) and Pisces B (bottom), superposed on the 3-color WISE w1+w2+w3 composite (left) and Galex NUV (right) images from the natural weighted cubes. Contours are at 0.3 (3σ), 0.6, 1.2, 1.8, 2.4, and 3.0 × 1019 cm-2. |
| In the text | |
|
Fig. 3 Global Hi profiles of Pisces A (top) and Pisces B (bottom), using the natural weighted cubes. Velocities are heliocentric. The gray profiles are those from TOL15. |
| In the text | |
|
Fig. 4 Velocity fields (the dashed line shows the optical PA) from Gaussian profiles fitting (left), velocity dispersion from moment analysis (center), and PV diagrams of the Hanning-smoothed data for Pisces A (top) and B (bottom), where the dashed lines show the systemic velocities. |
| In the text | |
Current usage metrics show cumulative count of Article Views (full-text article views including HTML views, PDF and ePub downloads, according to the available data) and Abstracts Views on Vision4Press platform.
Data correspond to usage on the plateform after 2015. The current usage metrics is available 48-96 hours after online publication and is updated daily on week days.
Initial download of the metrics may take a while.