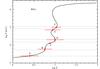
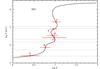
Fig. 5
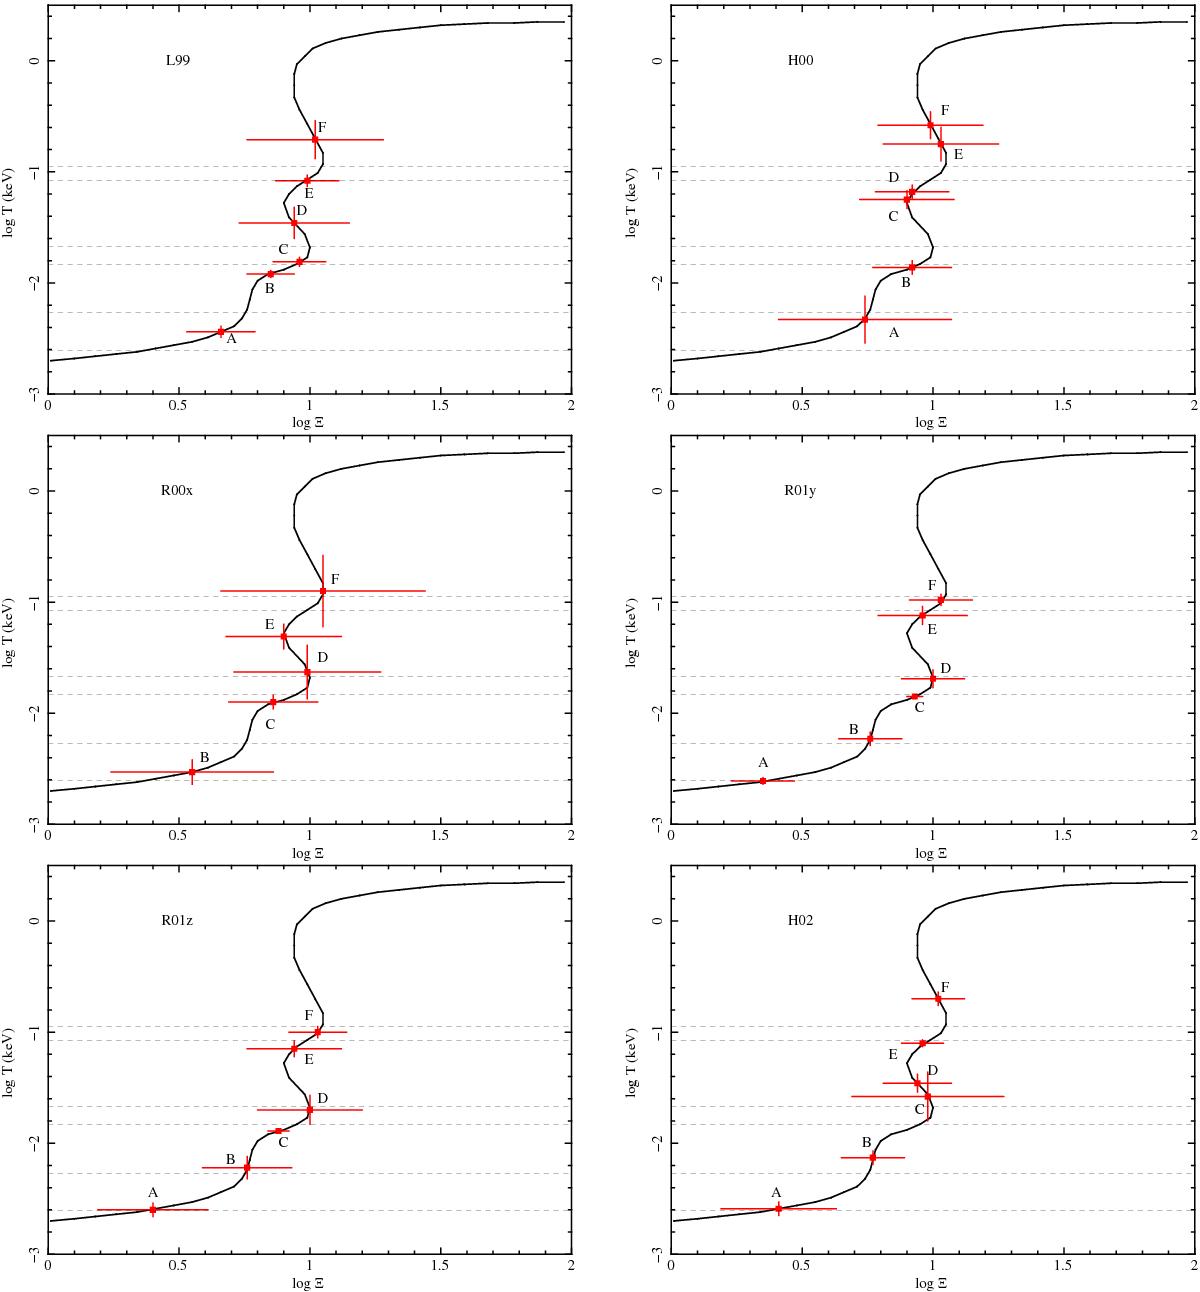
Thermal stability curves of the NGC 5548 archival observations (L99 and H00 in the top panels; R00x and R01y in the middle panels; R01z and H02 in the bottom panels) showing the pressure ionization parameter as a function of the electron temperature (solid line). The curves have been computed from the SED of Steenbrugge et al. (2005). The X-ray WA components in each observation are represented as solid squares (A to F). For comparison, the dashed horizontal lines represent in each panel the location of the WA components in the L02 observation.

Current usage metrics show cumulative count of Article Views (full-text article views including HTML views, PDF and ePub downloads, according to the available data) and Abstracts Views on Vision4Press platform.
Data correspond to usage on the plateform after 2015. The current usage metrics is available 48-96 hours after online publication and is updated daily on week days.
Initial download of the metrics may take a while.