Free Access
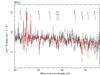
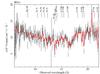
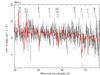
Fig. A.2
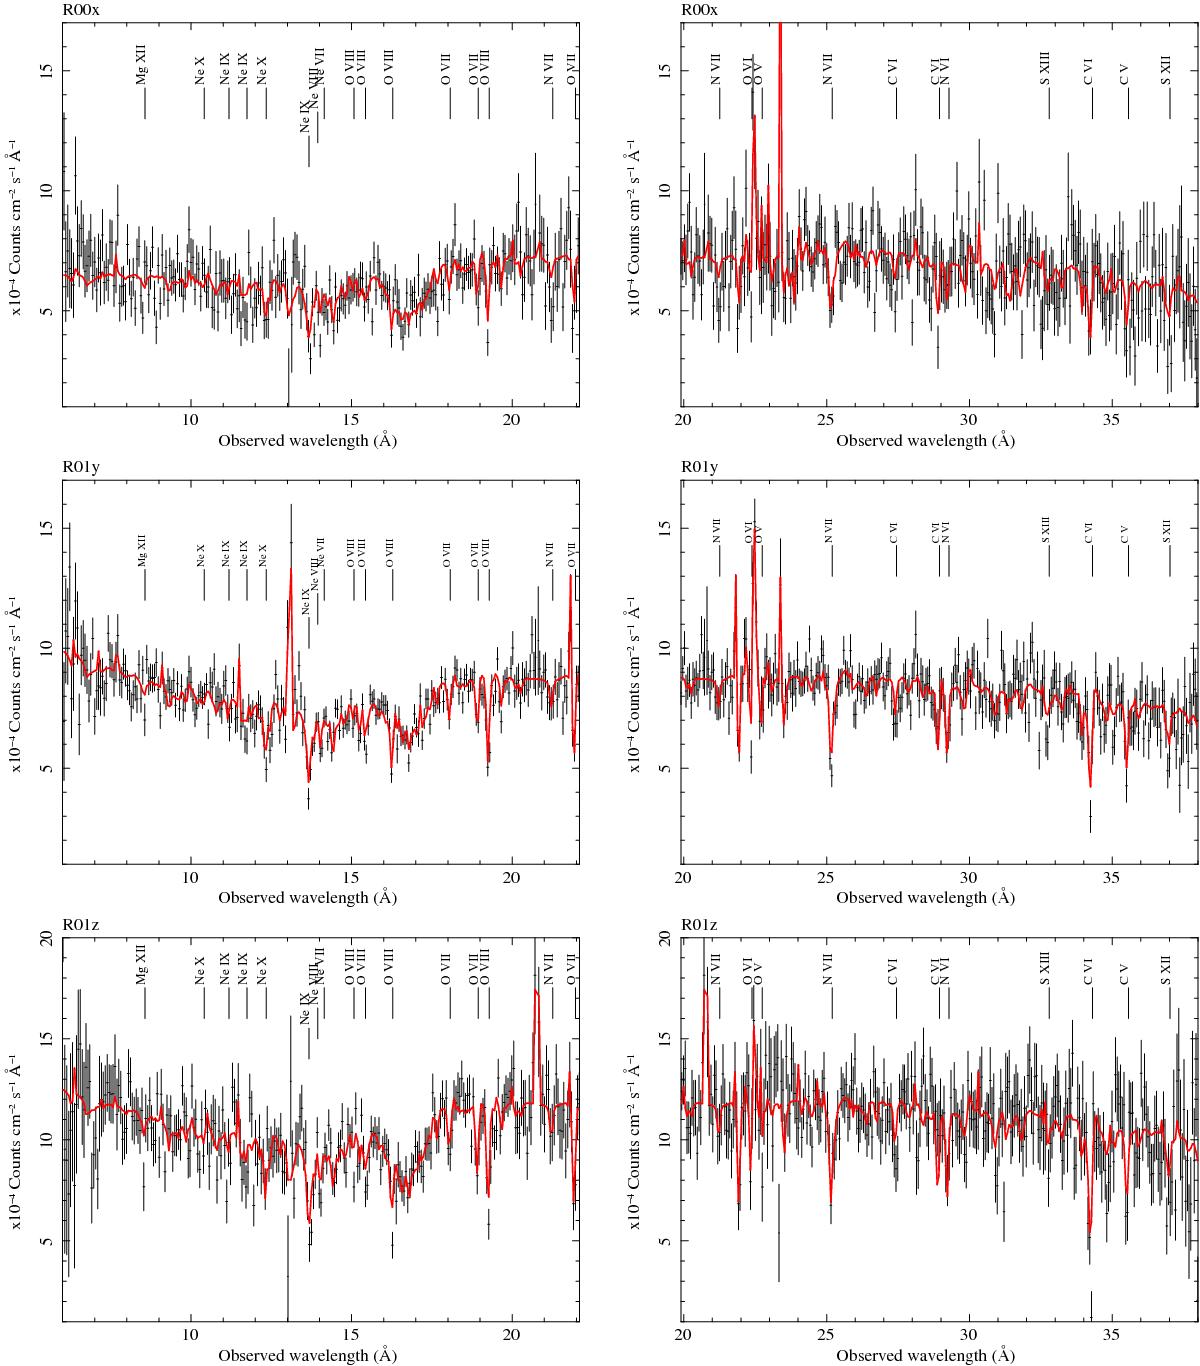
XMM-Newton RGS spectra of NGC 5548 in 2000 (R00x; top panels), and in 2001 (R01y, middle panels; R01z, bottom panels). The solid line represents our best-fit model. Some relevant WA absorption features have been labeled.
This figure is made of several images, please see below:
Current usage metrics show cumulative count of Article Views (full-text article views including HTML views, PDF and ePub downloads, according to the available data) and Abstracts Views on Vision4Press platform.
Data correspond to usage on the plateform after 2015. The current usage metrics is available 48-96 hours after online publication and is updated daily on week days.
Initial download of the metrics may take a while.