Free Access
Fig. 1
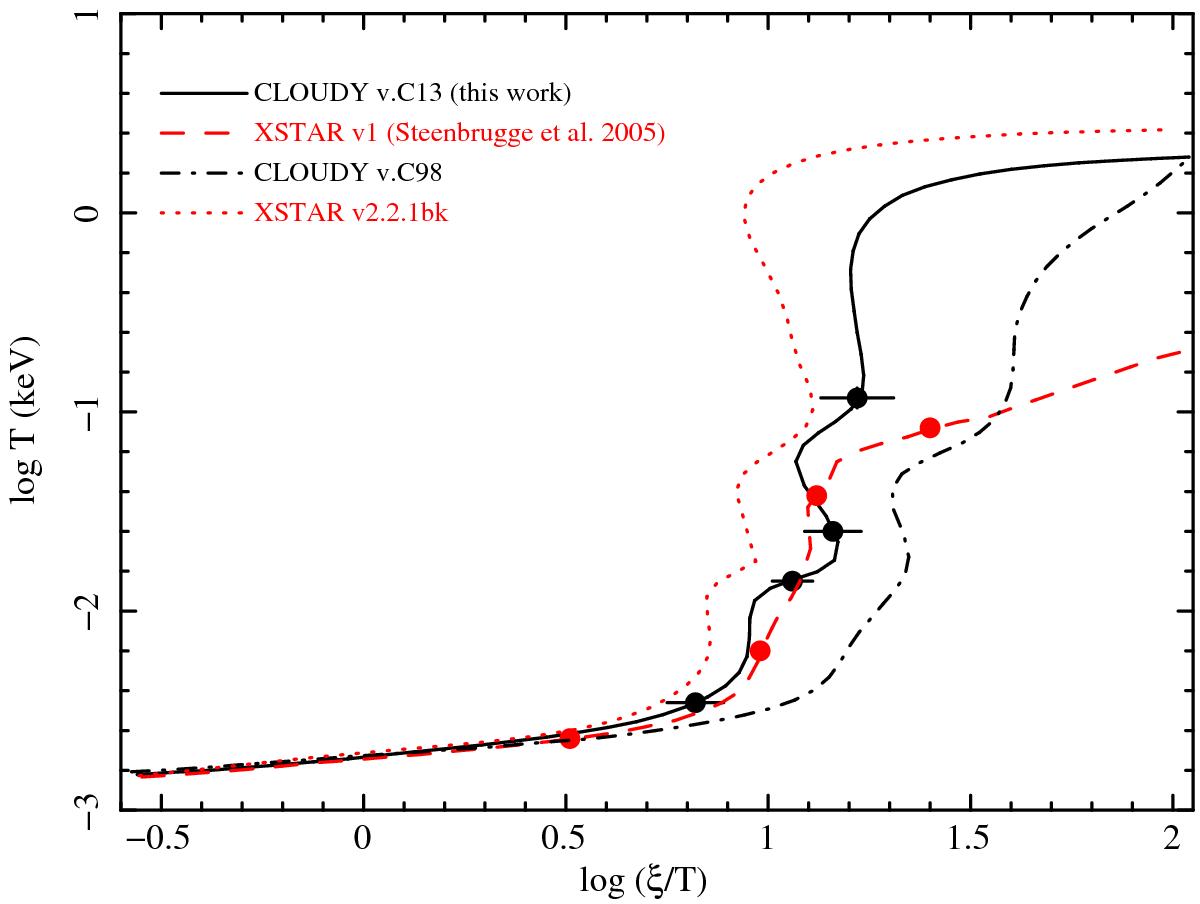
Stability curves obtained with different versions of XSTAR and CLOUDY (black solid line, CLOUDY v13; black dot-dashed line, CLOUDY v98; red dashed line, XSTAR v1; red dotted line, XSTAR v2.2.1bk) for the same input spectral energy distribution. The solid dots represent the WA components of Steenbrugge et al. (2005).
Current usage metrics show cumulative count of Article Views (full-text article views including HTML views, PDF and ePub downloads, according to the available data) and Abstracts Views on Vision4Press platform.
Data correspond to usage on the plateform after 2015. The current usage metrics is available 48-96 hours after online publication and is updated daily on week days.
Initial download of the metrics may take a while.