Free Access
Fig. 4
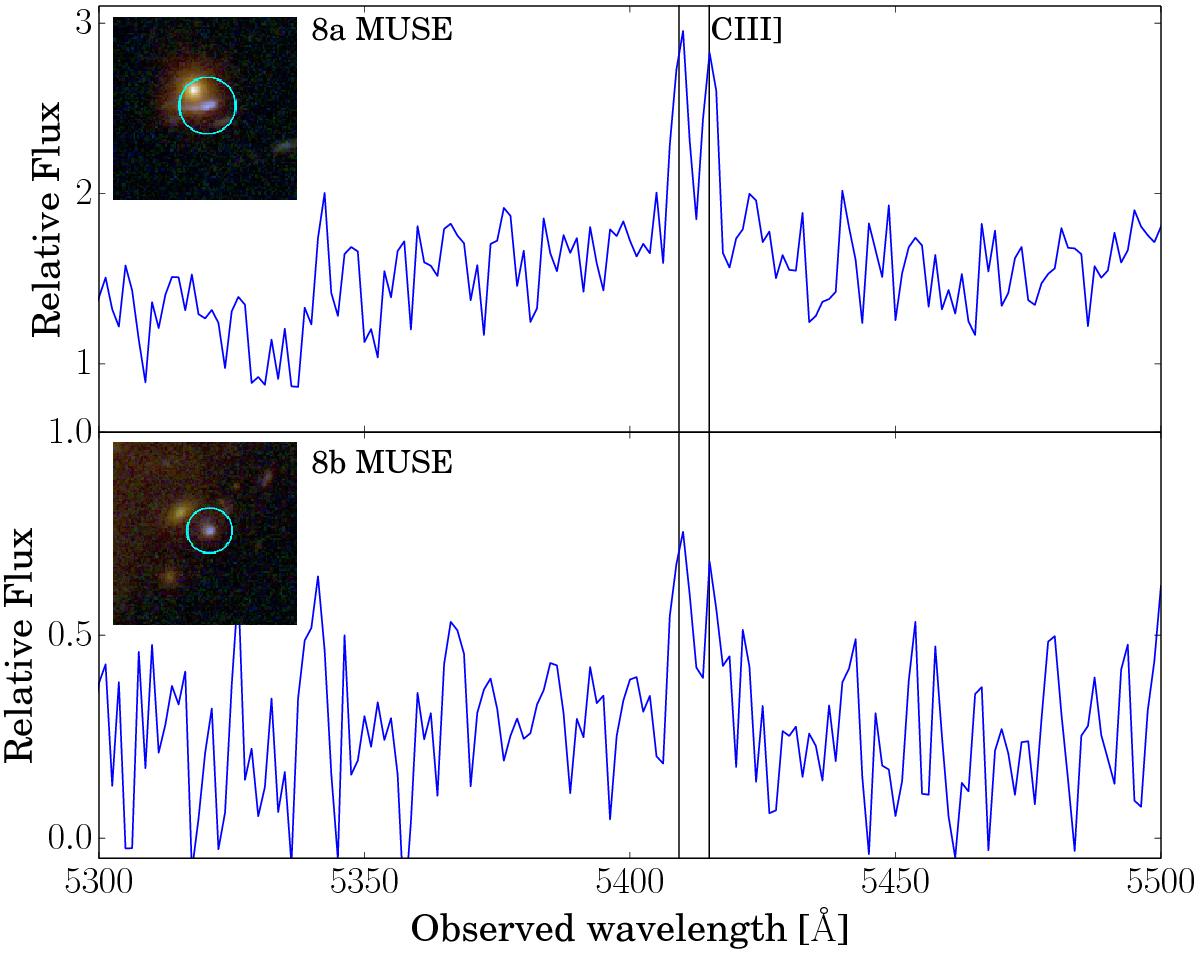
MUSE 1D spectra of the multiple images 8a and 8b. The vertical lines indicate the CIII] doublet emission wavelengths of a source at redshift 1.837. The small panels show the circles with 1″ (top) and ![]() (bottom) radius used to extract the two spectra. The flux is rescaled by a factor of 10-18 erg / s / cm2/Å.
(bottom) radius used to extract the two spectra. The flux is rescaled by a factor of 10-18 erg / s / cm2/Å.
Current usage metrics show cumulative count of Article Views (full-text article views including HTML views, PDF and ePub downloads, according to the available data) and Abstracts Views on Vision4Press platform.
Data correspond to usage on the plateform after 2015. The current usage metrics is available 48-96 hours after online publication and is updated daily on week days.
Initial download of the metrics may take a while.