Fig. 13
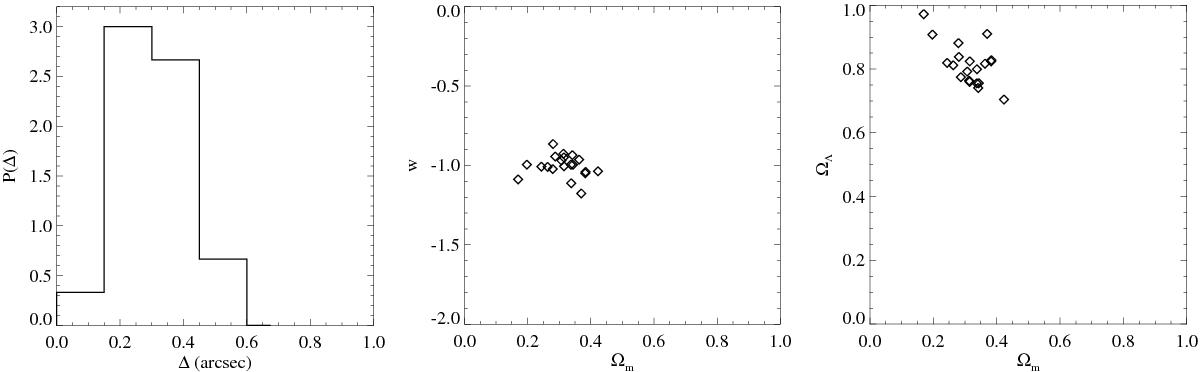
Left panel: probability distribution function, obtained from the set of 20 simulations, of the Δrms offset between the perturbed and best-fitting model-predicted positions of the 24 multiple images. The predicted positions are determined by optimizing the parameters of the total mass distribution of the main lens not including the mass perturbers along the line-of-sight. Middle and right panels: best-fitting values of the parameters Ωm, ΩΛ and w from the set of 20 simulations. These values are determined by optimizing the parameters of the total mass distribution of the main lens and of the cosmological model not including in the mass perturbers along the line-of-sight.
Current usage metrics show cumulative count of Article Views (full-text article views including HTML views, PDF and ePub downloads, according to the available data) and Abstracts Views on Vision4Press platform.
Data correspond to usage on the plateform after 2015. The current usage metrics is available 48-96 hours after online publication and is updated daily on week days.
Initial download of the metrics may take a while.