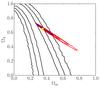
Fig. 10
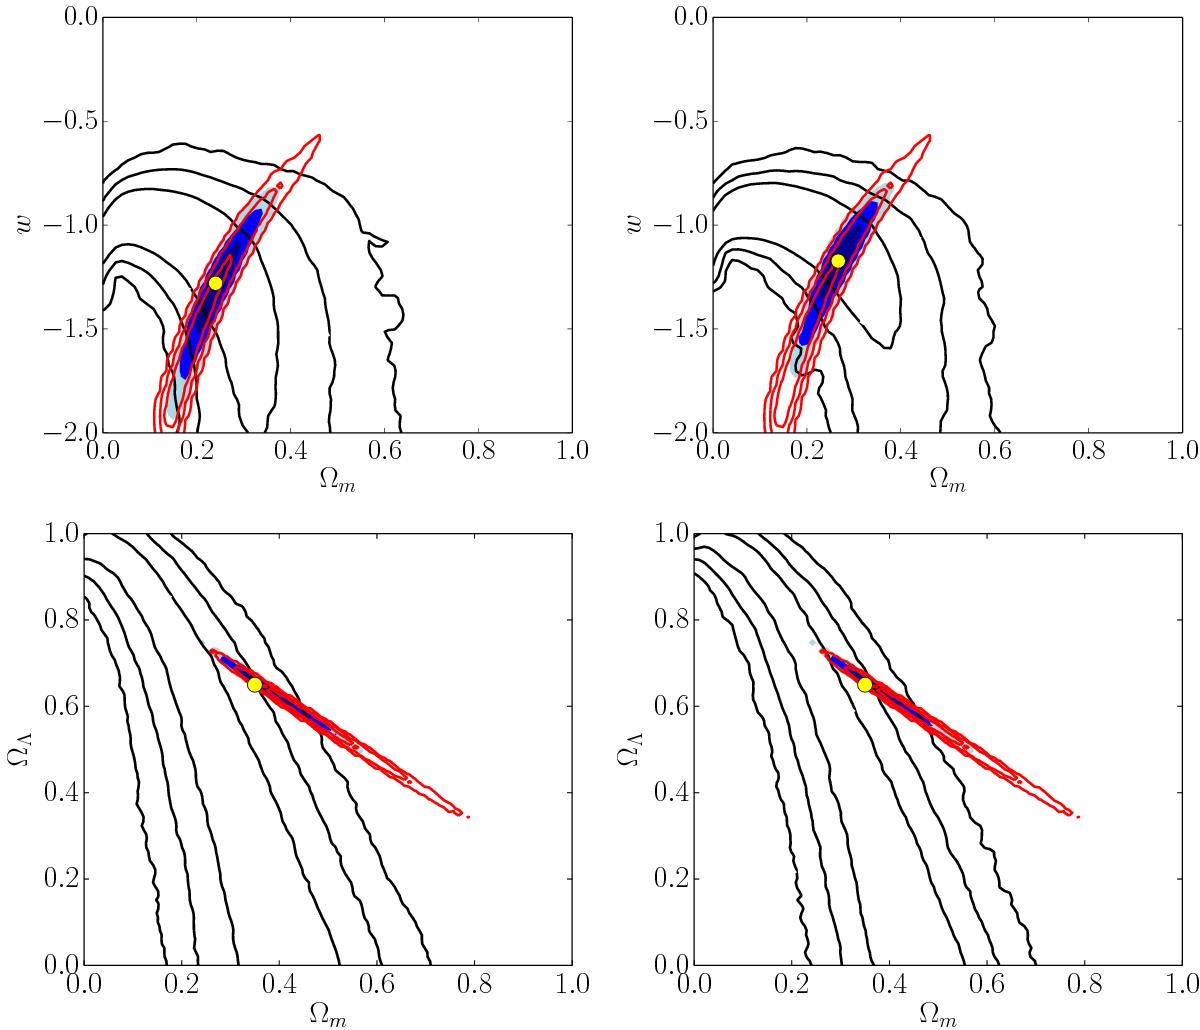
Confidence levels (black lines) for the cosmological parameters of models W1 and W2 (Ωm + ΩΛ = 1, top panels) and L1 and L2 (w = −1, bottom panels). Left panels refer to strong lensing models using only spectroscopic families (L1, W1); models in the right panels include all families (L2, W2). Red lines: contours from Planck Data Release 2 data. Blue regions: combined constraints. The yellow circles indicate the maximum likelihood peak in this projection.
Current usage metrics show cumulative count of Article Views (full-text article views including HTML views, PDF and ePub downloads, according to the available data) and Abstracts Views on Vision4Press platform.
Data correspond to usage on the plateform after 2015. The current usage metrics is available 48-96 hours after online publication and is updated daily on week days.
Initial download of the metrics may take a while.