Fig. 7
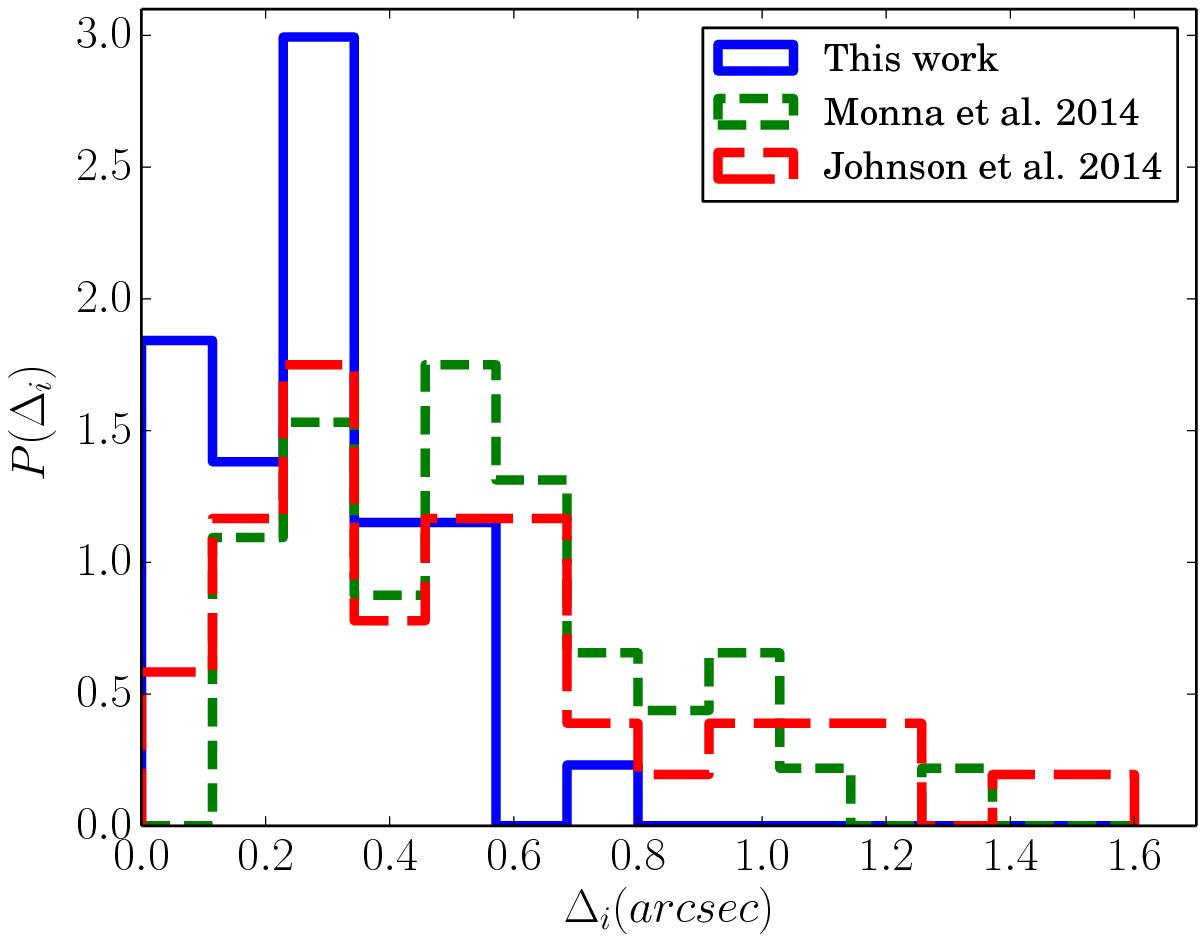
Distribution of the displacement values of the multiple images (absolute values of the observed minus the reconstructed positions, see Eq. (6)) obtained from our reference model F2 (solid blue line) and in previous works by Monna et al. (2014; green dashed) and Johnson et al. (2014; red long dashed), for the cluster RXC J2248.
Current usage metrics show cumulative count of Article Views (full-text article views including HTML views, PDF and ePub downloads, according to the available data) and Abstracts Views on Vision4Press platform.
Data correspond to usage on the plateform after 2015. The current usage metrics is available 48-96 hours after online publication and is updated daily on week days.
Initial download of the metrics may take a while.