Free Access
Fig. 3
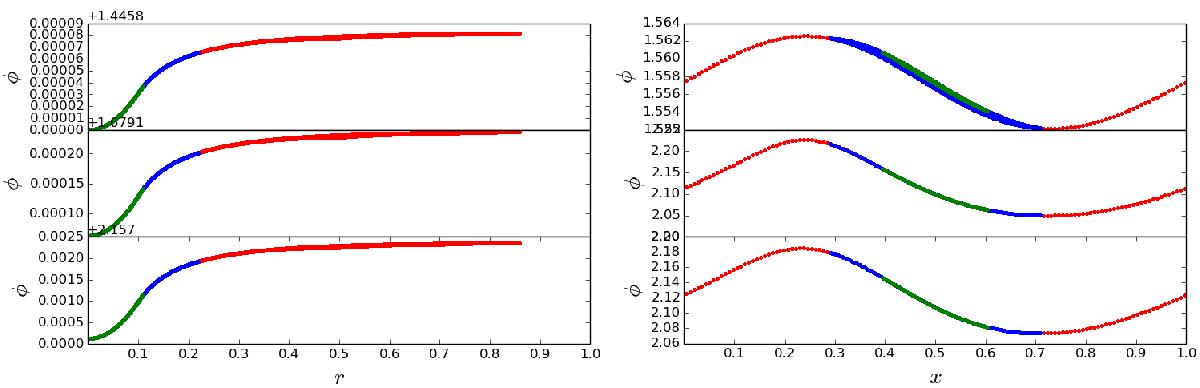
Scalar field from tests. Different colors depict the different refinement levels. The left panel shows the field from a spherical density distribution, the right side shows a 1D sine field obtained in the second test.
Current usage metrics show cumulative count of Article Views (full-text article views including HTML views, PDF and ePub downloads, according to the available data) and Abstracts Views on Vision4Press platform.
Data correspond to usage on the plateform after 2015. The current usage metrics is available 48-96 hours after online publication and is updated daily on week days.
Initial download of the metrics may take a while.