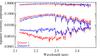
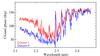
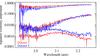
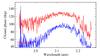
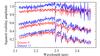
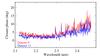
Fig. 2

Direct comparison of (left) the visibility function and (right) the closure phases of data obtained of the same source at virtually the same baseline length and angle but at different epochs. From top to bottom: data sets 1&6 of R Cnc, 2&4 of R Cnc, 9&11 of X Hya, cf. Table 1. Errors of the squared visibility amplitudes are in the range of 5–15%; errors of the closure phases are in the range of 5–15 deg.
Current usage metrics show cumulative count of Article Views (full-text article views including HTML views, PDF and ePub downloads, according to the available data) and Abstracts Views on Vision4Press platform.
Data correspond to usage on the plateform after 2015. The current usage metrics is available 48-96 hours after online publication and is updated daily on week days.
Initial download of the metrics may take a while.