Fig. 8
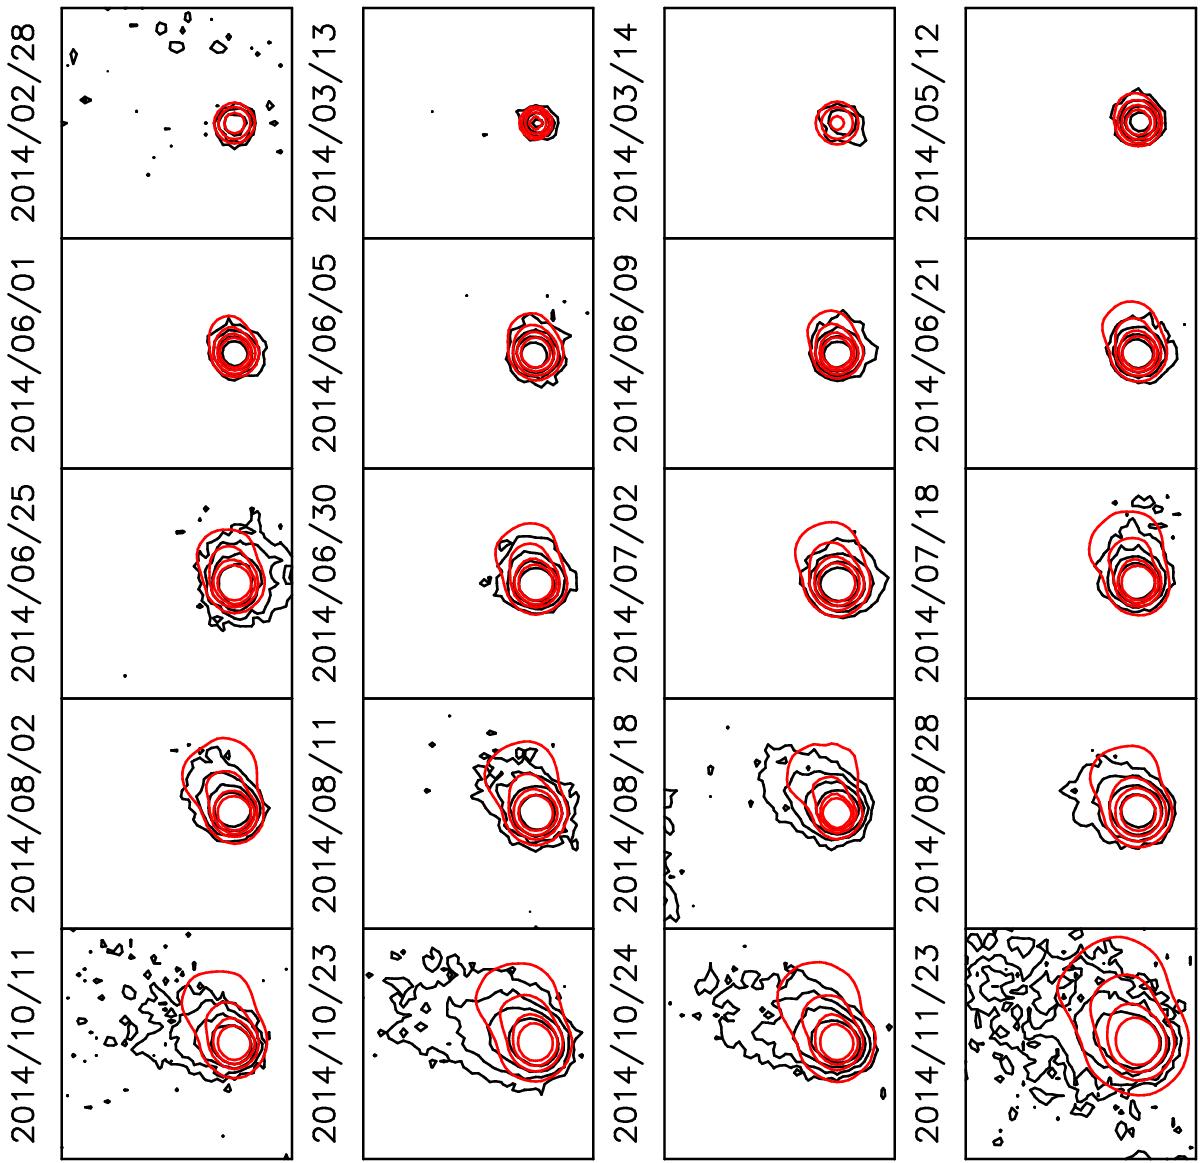
Monte Carlo dust tail code simulations (red contours) compared to the VLT observations (black contours) for the input parameters derived from Rotundi et al. (2015) with a power-law exponent of the size distribution function of –2. The image dates are shown on the left side of each panel. Innermost isophotes are 4 × 10-14 solar disk units, except for panels 2014/02/28 and 2014/03/14, which have 2 × 10-14 solar disk units.
Current usage metrics show cumulative count of Article Views (full-text article views including HTML views, PDF and ePub downloads, according to the available data) and Abstracts Views on Vision4Press platform.
Data correspond to usage on the plateform after 2015. The current usage metrics is available 48-96 hours after online publication and is updated daily on week days.
Initial download of the metrics may take a while.