Fig. 4
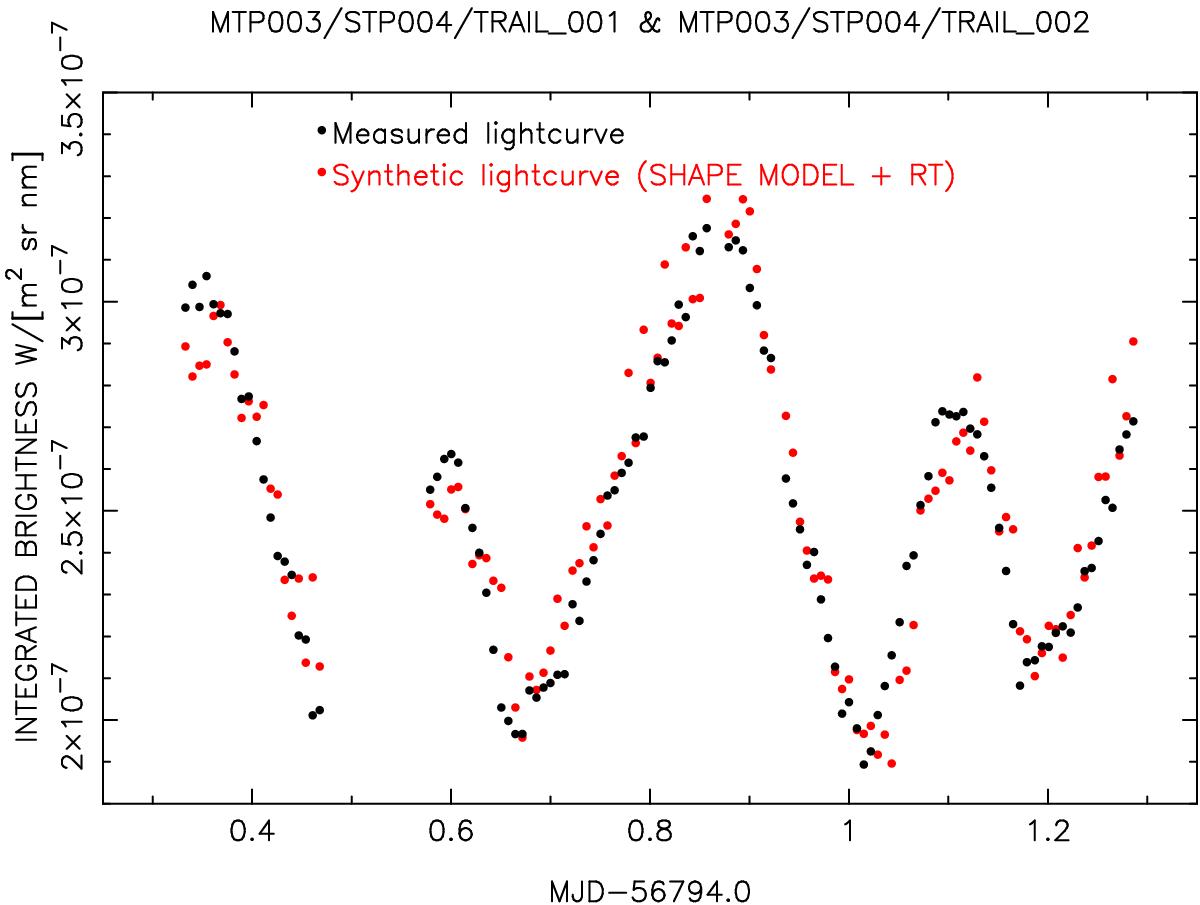
Lightcurve obtained from the analysis of 117 frames from WAC Red filter images obtained on 2014 May 17 and 18 (black dots). The red dots correspond to a simulation of the lightcurve, taking in consideration a nucleus shape model (Preusker et al. 2015) with a Lambertian model for the surface, which has an albedo of 0.06, and a ray-tracing technique to compute the total output flux at the S/C position.
Current usage metrics show cumulative count of Article Views (full-text article views including HTML views, PDF and ePub downloads, according to the available data) and Abstracts Views on Vision4Press platform.
Data correspond to usage on the plateform after 2015. The current usage metrics is available 48-96 hours after online publication and is updated daily on week days.
Initial download of the metrics may take a while.